Fig. 6
Download original image
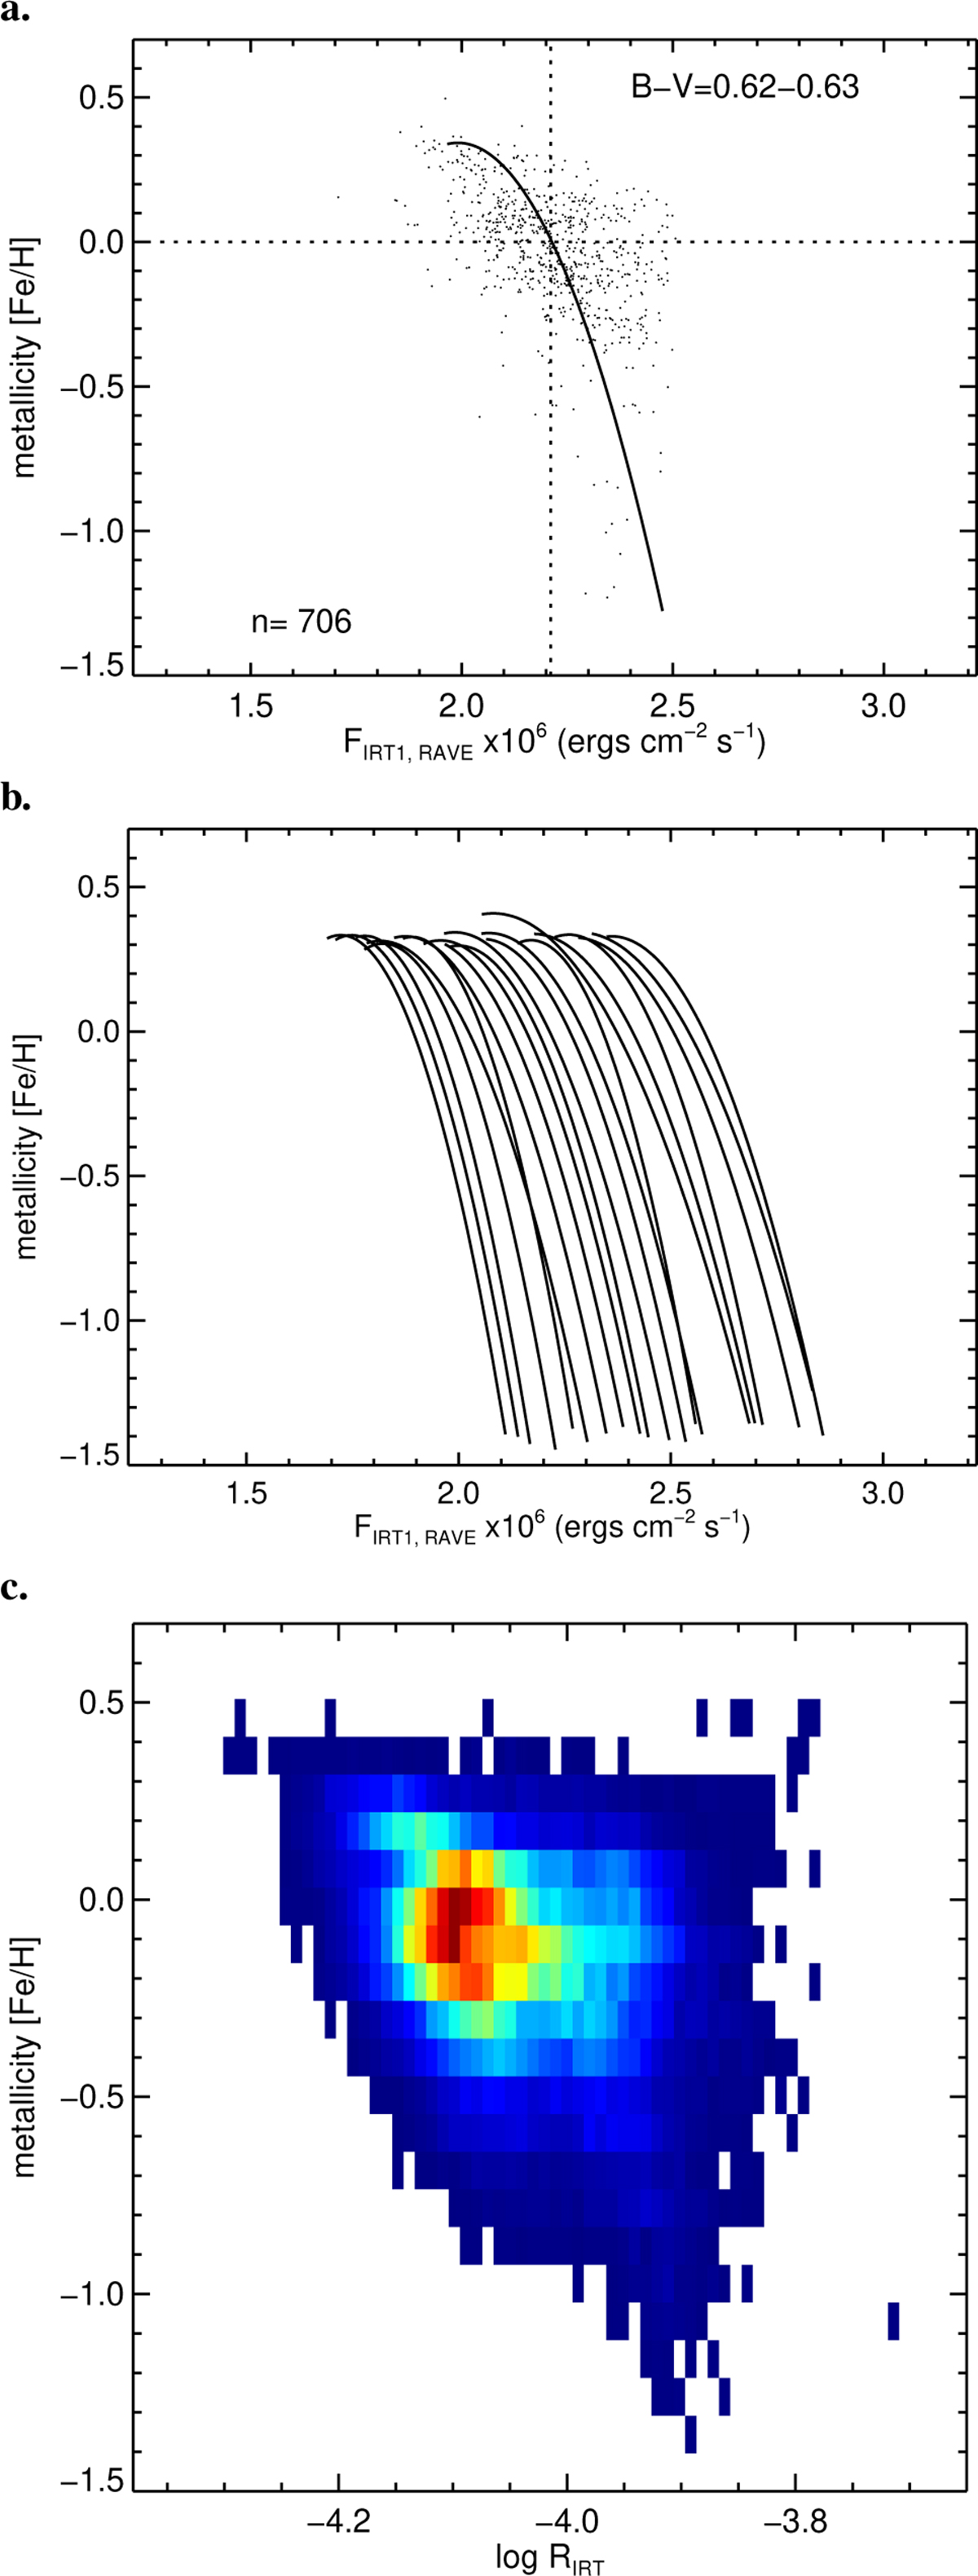
Dependency of Ca II IRT flux on metallicity. a. Example relation for a colour bin of B–V=0.62–0.63 for IRT-1 (log-linear presentation). Small dots are the data of 706 targets in this B–V bin. The line is a polynomial fit of the second order. b. Overplot of the polynomial fits for all B–V bins. c. Logarithmic radiative loss from the entire triplet and for the full available B–V range. The colour denotes the number density (darkest red is 600, darkest blue is 1 target).
Current usage metrics show cumulative count of Article Views (full-text article views including HTML views, PDF and ePub downloads, according to the available data) and Abstracts Views on Vision4Press platform.
Data correspond to usage on the plateform after 2015. The current usage metrics is available 48-96 hours after online publication and is updated daily on week days.
Initial download of the metrics may take a while.