Fig. 5
Download original image
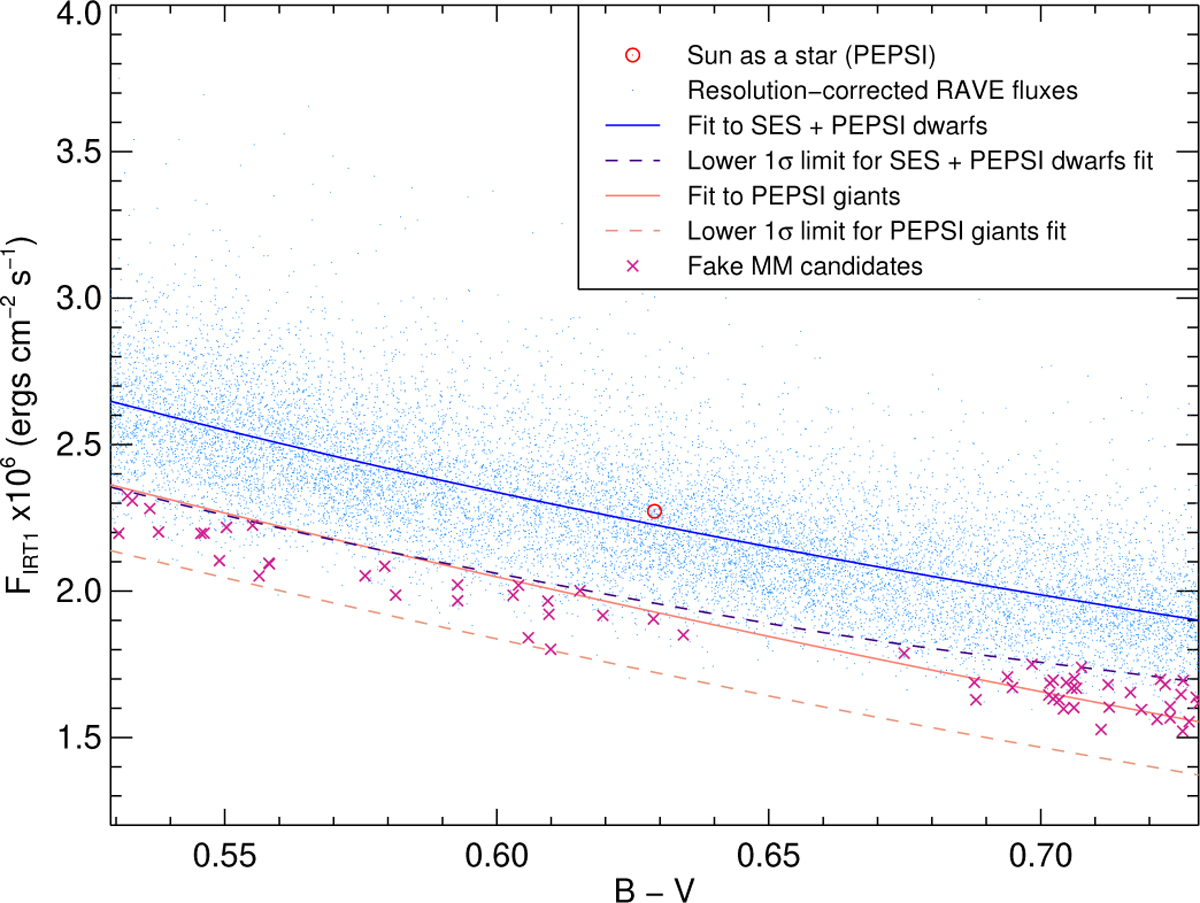
Resolution-corrected RAVE Ca II IRT-1 fluxes for a limited B–V range (14585 targets) and S/N>40. The continuous blue line is the fit to the high-resolution dwarf sample already shown in Fig. 4. The dashed blue line is its 1σ lower bound. Also shown is the fit to the GBS-giants from PEPSI spectra (continuous orange line) and its 1σ lower bound for comparison. The targets within the two dashed lines were additionally constrained by requiring them to fall below the upper bound in all three IRT lines and are highlighted as crosses (and listed in the Appendix in Table C.4). All except one of these candidates turned out to exhibit supersolar metallicity. We thus called them fake MM candidates.
Current usage metrics show cumulative count of Article Views (full-text article views including HTML views, PDF and ePub downloads, according to the available data) and Abstracts Views on Vision4Press platform.
Data correspond to usage on the plateform after 2015. The current usage metrics is available 48-96 hours after online publication and is updated daily on week days.
Initial download of the metrics may take a while.