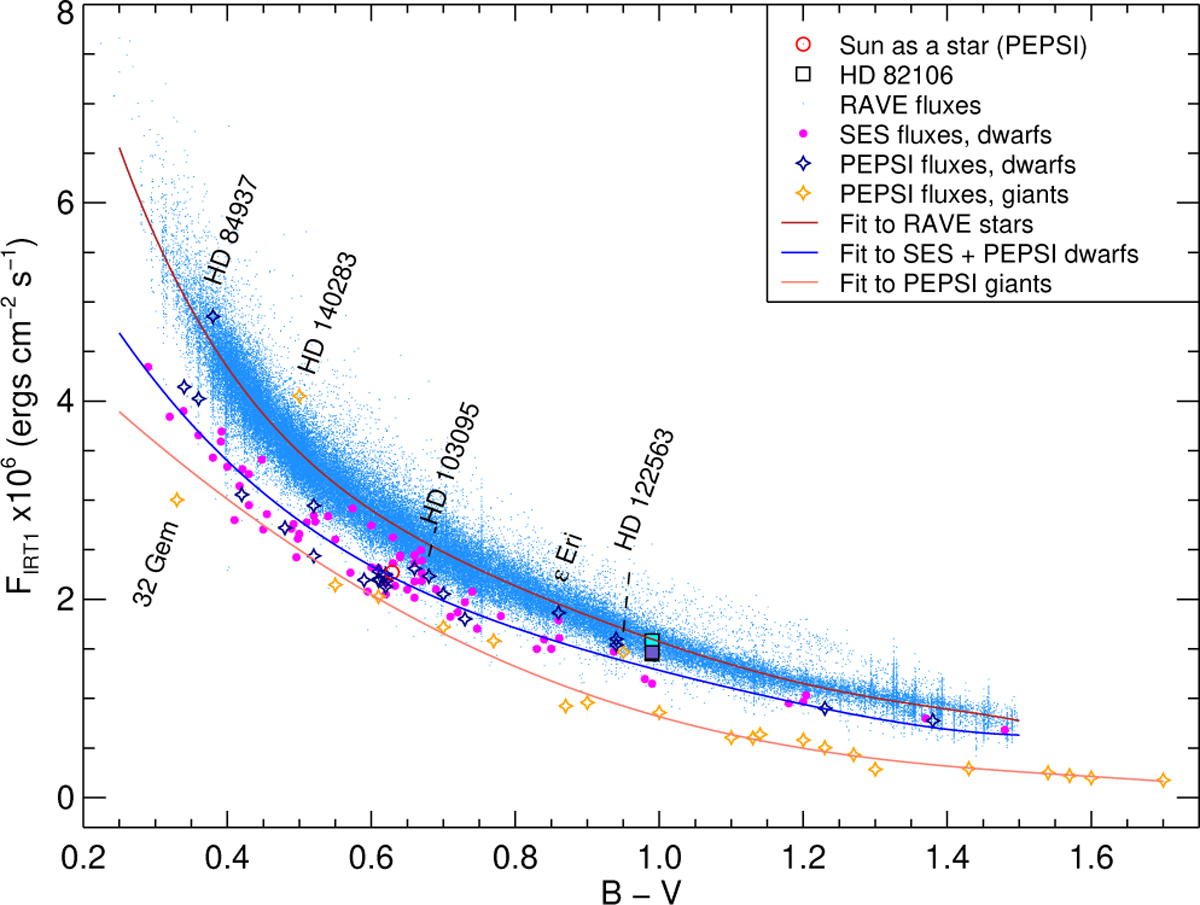
Fig. 4

Download original image
Ca II IRT-1 fluxes for our three instrument samples. RAVE data points are plotted with light blue dots, except for HD 82106 for which a cyan square is used. The fit to them is presented with a dark red line. STELLA-SES data points, both the common sample with RAVE as well as the MK standards are plotted with filled magenta circles, HD 82106 is plotted with a light blue square. PEPSI data points are plotted as follows: blue diamonds are used for dwarfs, yellow diamonds are used for giants, the Sun is plotted with red solar symbol, and HD 82106 is plotted with a violet square. The orange fit is for the giants only. The blue fit is based on both STELLA-SES and PEPSI dwarfs. RAVE fluxes appear on average higher than STELLA-SES and PEPSI fluxes by 19% for IRT-1, 21% for IRT-2, and 25% for IRT-3.
Current usage metrics show cumulative count of Article Views (full-text article views including HTML views, PDF and ePub downloads, according to the available data) and Abstracts Views on Vision4Press platform.
Data correspond to usage on the plateform after 2015. The current usage metrics is available 48-96 hours after online publication and is updated daily on week days.
Initial download of the metrics may take a while.


