Open Access
Fig. B.11
Download original image
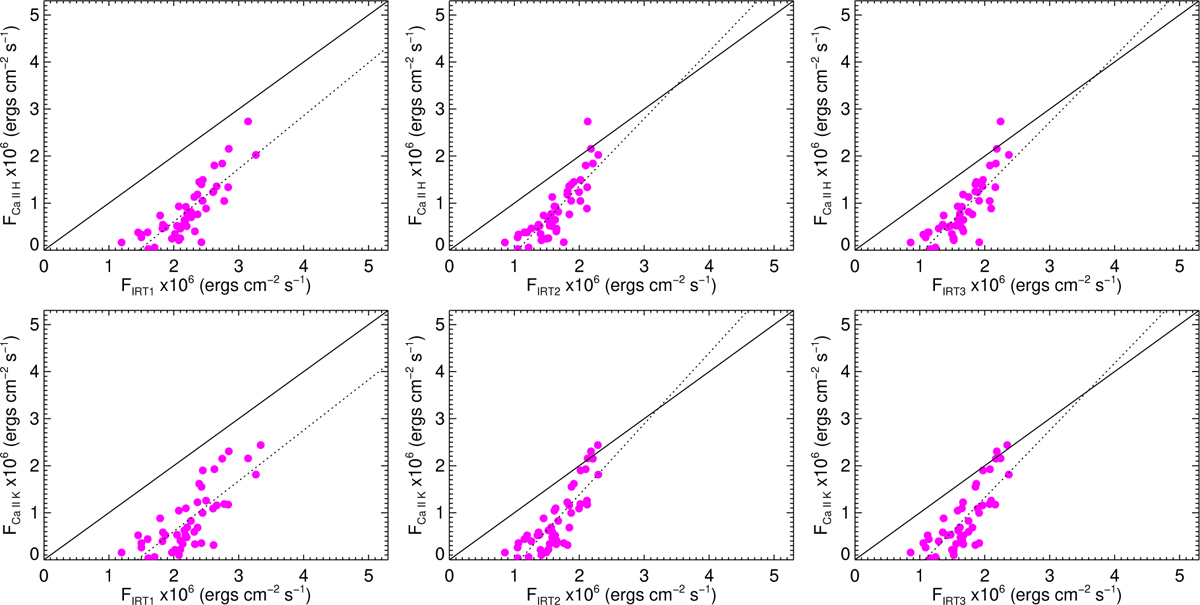
Flux-flux relationships between Ca II IRT lines and Ca II H&K line using STELLA-SES spectra. The solid black lines represent 1:1 relations while the dashed lines are the fits to the data points. Top: IRT lines vs. Ca II H. Bottom: IRT lines vs. Ca II K.
Current usage metrics show cumulative count of Article Views (full-text article views including HTML views, PDF and ePub downloads, according to the available data) and Abstracts Views on Vision4Press platform.
Data correspond to usage on the plateform after 2015. The current usage metrics is available 48-96 hours after online publication and is updated daily on week days.
Initial download of the metrics may take a while.