Open Access
Fig. B.2
Download original image
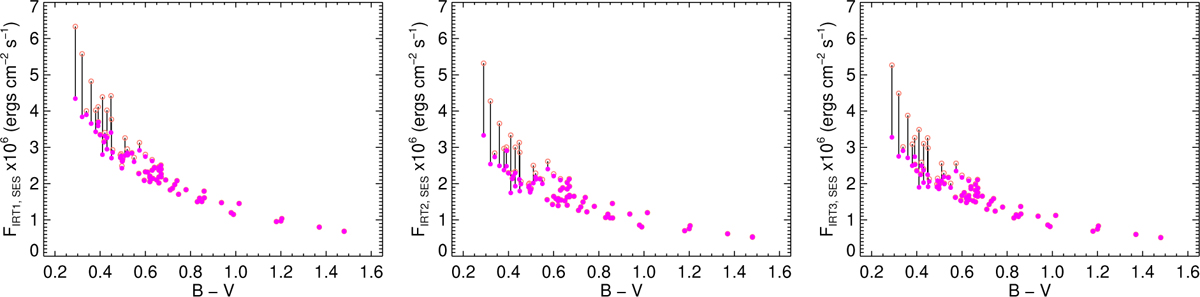
Visualisation of the v sin i correction using fluxes based on STELLA-SES spectra. The salmon open circles represent stars observed with STELLA before the v sin i correction was made and magenta filled circles represent the after positions. For clarity, black lines connect the points with large changes.
Current usage metrics show cumulative count of Article Views (full-text article views including HTML views, PDF and ePub downloads, according to the available data) and Abstracts Views on Vision4Press platform.
Data correspond to usage on the plateform after 2015. The current usage metrics is available 48-96 hours after online publication and is updated daily on week days.
Initial download of the metrics may take a while.