Open Access
Fig. B.1
Download original image
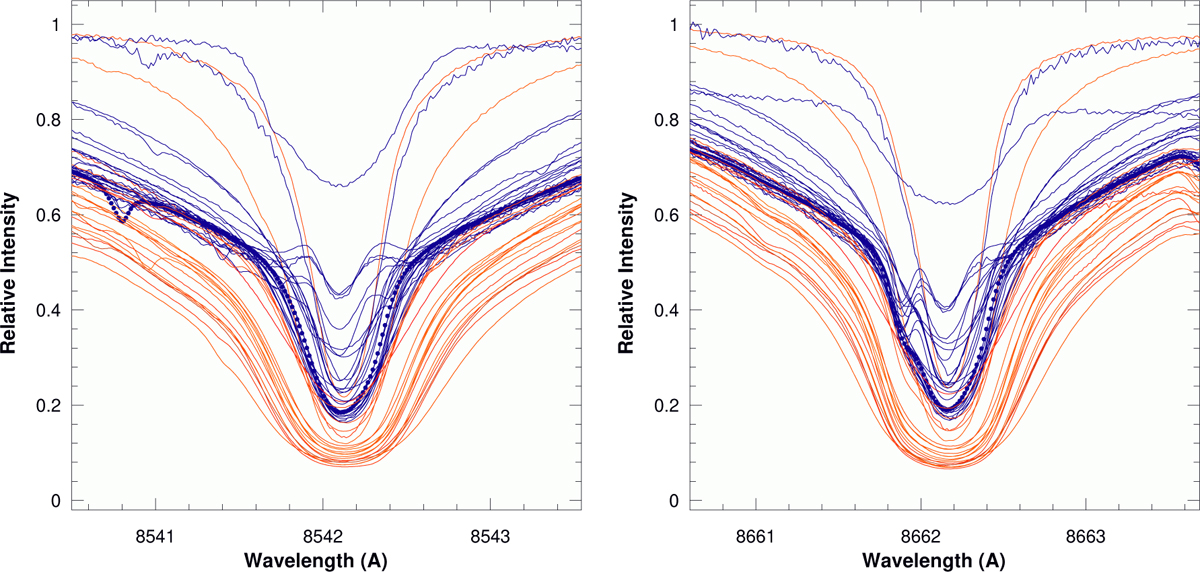
Ultra-high resolution Ca II IRT-2 (left) and IRT-3 (right) line profiles of the Gaia benchmark stars observed with PEPSI. Blue spectra are the dwarf stars, red spectra the giants. The solar spectrum is shown as dots. IRT-1 is shown in Fig. 2 in the main text.
Current usage metrics show cumulative count of Article Views (full-text article views including HTML views, PDF and ePub downloads, according to the available data) and Abstracts Views on Vision4Press platform.
Data correspond to usage on the plateform after 2015. The current usage metrics is available 48-96 hours after online publication and is updated daily on week days.
Initial download of the metrics may take a while.