Open Access
Fig. 1
Download original image
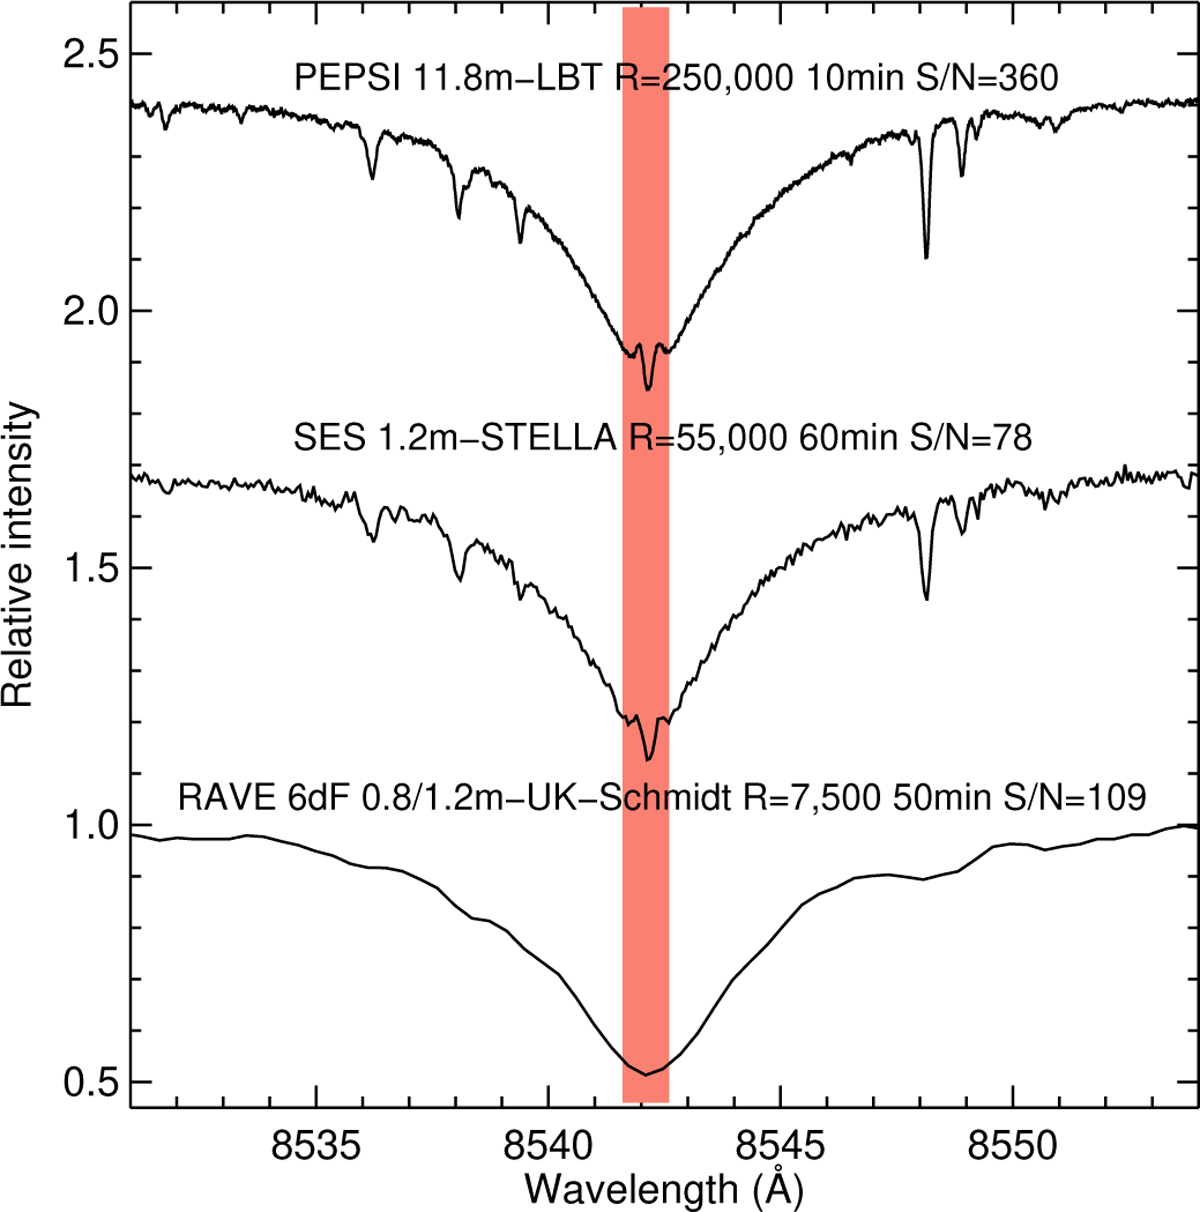
Ca II IRT-2 line profile of HD 82106 (K3 V, v sin i = 3.0 km s−1) at three different spectral resolutions: RAVE R=7500; STELLA R=55 000; and PEPSI R=250 000. The spectra are on the same scale but shifted in intensity for better viewing. The vertical shaded area indicates the 1-Å integration window for the line-core fluxes.
Current usage metrics show cumulative count of Article Views (full-text article views including HTML views, PDF and ePub downloads, according to the available data) and Abstracts Views on Vision4Press platform.
Data correspond to usage on the plateform after 2015. The current usage metrics is available 48-96 hours after online publication and is updated daily on week days.
Initial download of the metrics may take a while.