Open Access
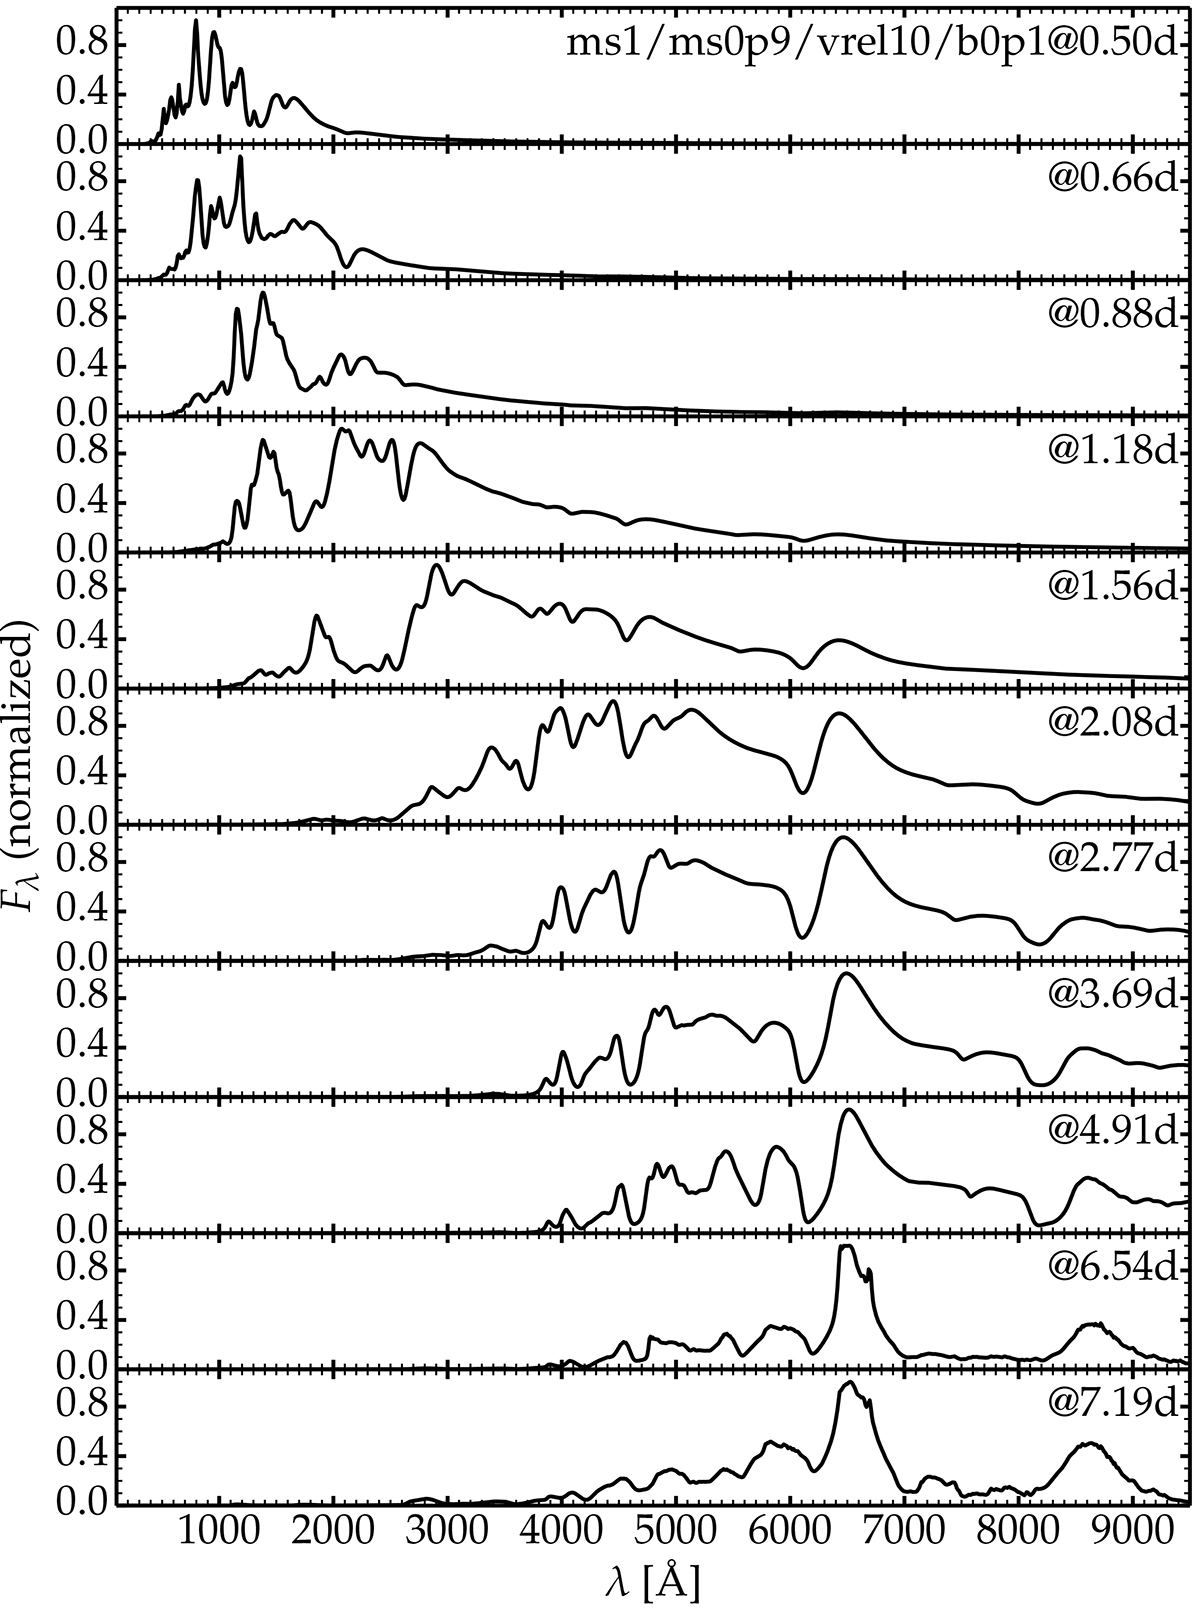
Fig. 7.
Download original image
Spectral evolution from the UV to the optical and from ∼0.5 until ∼7.2 d for model ms1/ms0p9/vrel10/b0p1 (modelset # 1). Fλ represents the spectral flux density or the flux per unit wavelength interval. Corresponding results for all models from the six sets are shown in Appendix B.
Current usage metrics show cumulative count of Article Views (full-text article views including HTML views, PDF and ePub downloads, according to the available data) and Abstracts Views on Vision4Press platform.
Data correspond to usage on the plateform after 2015. The current usage metrics is available 48-96 hours after online publication and is updated daily on week days.
Initial download of the metrics may take a while.