Fig. 3.
Download original image
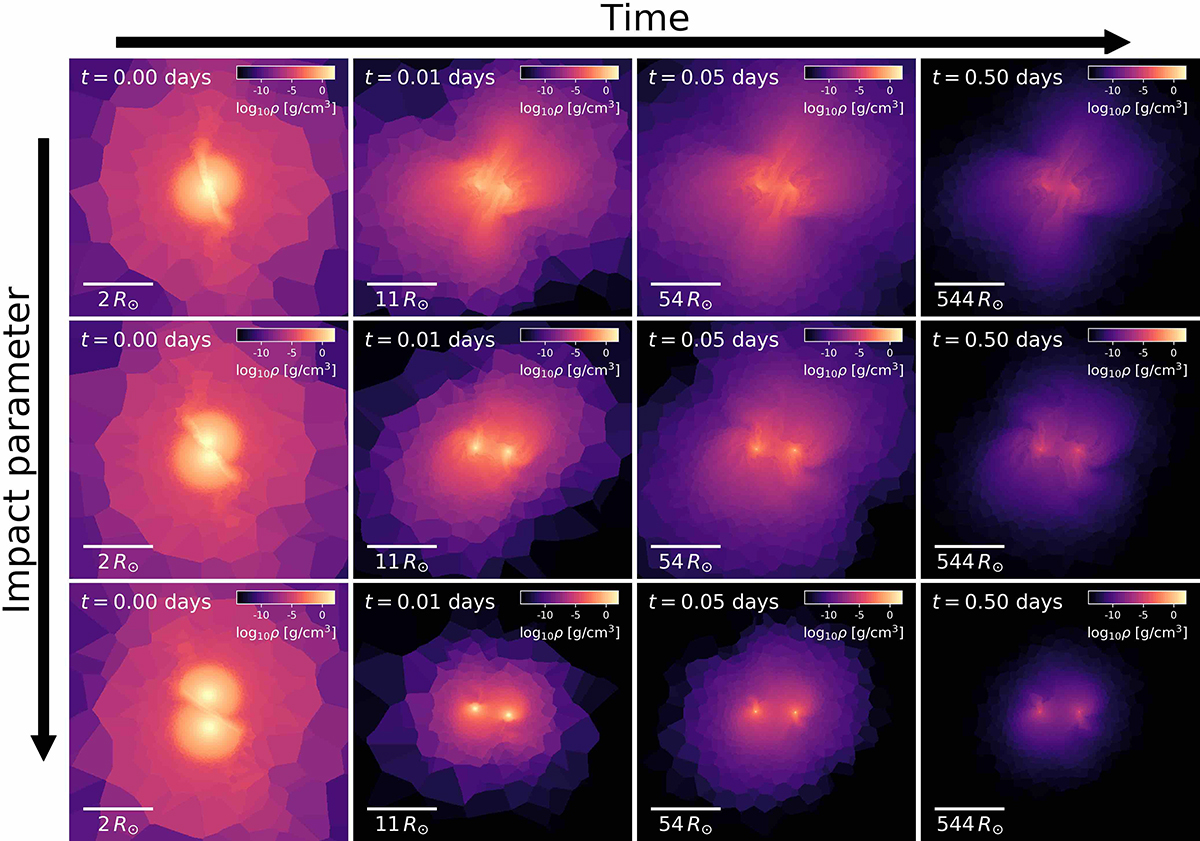
Gas density distribution at successive moments in main-sequence star collisions with M1 = 1 M⊙, M2 = 0.9 M⊙, Vrel = 5000 km s−1, but different impact parameters. These AREPO simulations of stellar collisions are characterized by b = 0.1, 0.25, and 0.5 (from top to bottom) and shown here at t = 0.0, 0.01, 0.05, and 0.5 d (from left to right).
Current usage metrics show cumulative count of Article Views (full-text article views including HTML views, PDF and ePub downloads, according to the available data) and Abstracts Views on Vision4Press platform.
Data correspond to usage on the plateform after 2015. The current usage metrics is available 48-96 hours after online publication and is updated daily on week days.
Initial download of the metrics may take a while.