Fig. 11.
Download original image
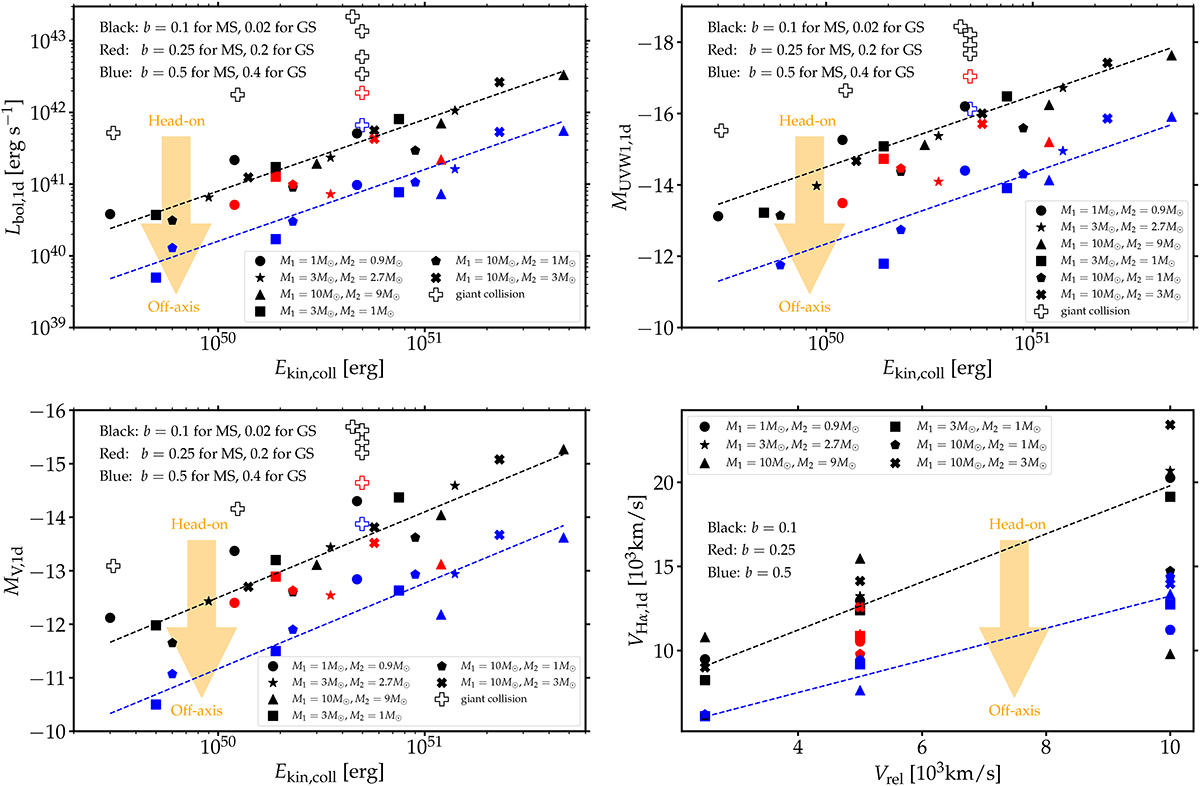
Bolometric luminosity Lbol,1d (top-left) and UVW1-band magnitudes MUVW1,1d (top-right), V-band magnitudes MV,1d (bottom-left) as a function of initial kinetic energy Ekin,coll and the Doppler velocity VHα,1d (bottom-right) at maximum absorption measured in the Hα line profile as a function of Vrel. All these values are measured at 1 d since collision. We distinguish collisions with different masses using different markers and those with different impact parameters using different colors. The black and blue diagonal lines show the relations given by the fitting formulae in Equations (4)–(7) for b = 0.1 and 0.5, respectively. In the top panels and bottom-left panel, the empty crosses represent values for giant collisions considered in Ryu et al. (2024b).
Current usage metrics show cumulative count of Article Views (full-text article views including HTML views, PDF and ePub downloads, according to the available data) and Abstracts Views on Vision4Press platform.
Data correspond to usage on the plateform after 2015. The current usage metrics is available 48-96 hours after online publication and is updated daily on week days.
Initial download of the metrics may take a while.