Fig. 9
Download original image
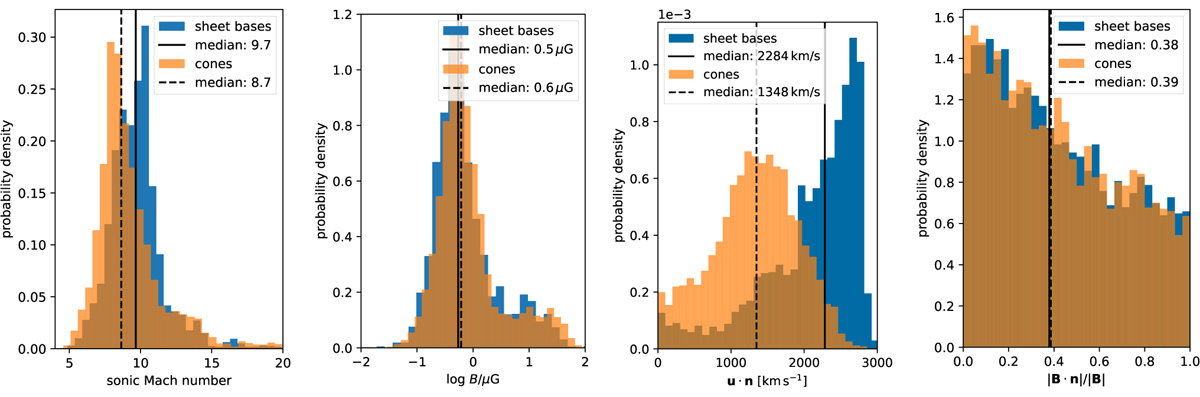
Properties in the immediate upstream of sheet base shocks and wind cones at 390 kyr of simulation time. The histograms were compiled from values along 10 000 randomly drawn line-outs. The distribution of values at sheet bases and cones is similar for most parameters, except the velocity across the shock, u · n (panel 3). (For further description, see the text.)
Current usage metrics show cumulative count of Article Views (full-text article views including HTML views, PDF and ePub downloads, according to the available data) and Abstracts Views on Vision4Press platform.
Data correspond to usage on the plateform after 2015. The current usage metrics is available 48-96 hours after online publication and is updated daily on week days.
Initial download of the metrics may take a while.