Open Access
Fig. 6
Download original image
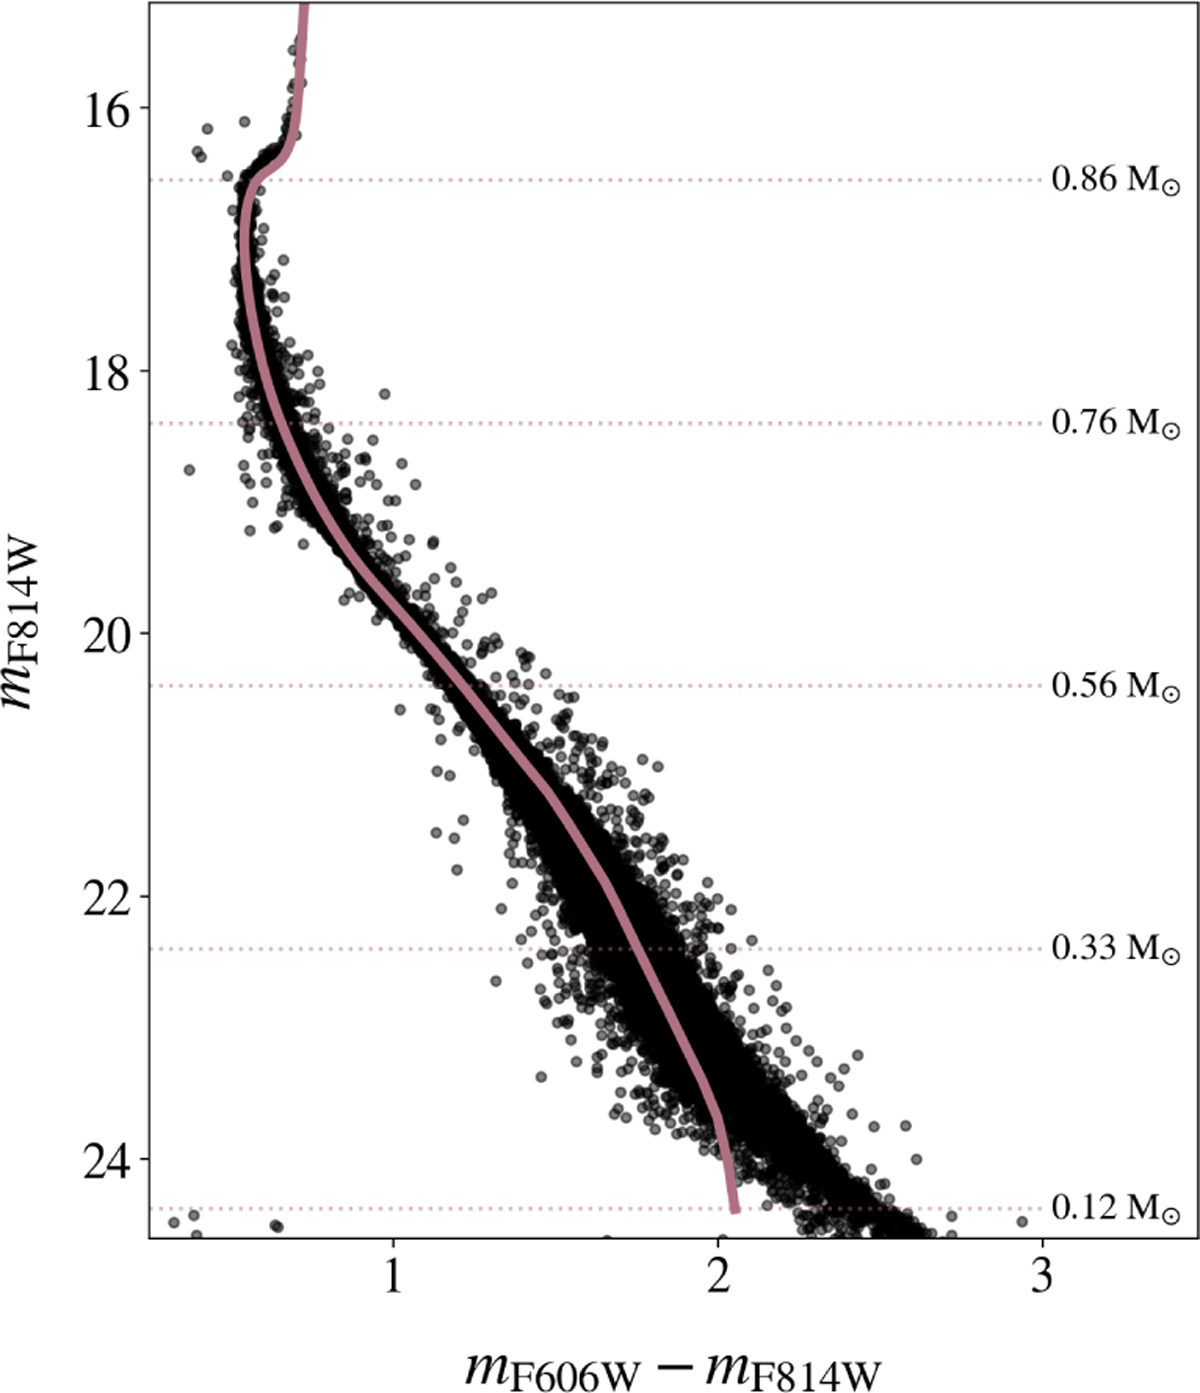
Color-magnitude diagram of mF814W versus mF606W - mF814W of stars in Field A. The pink line represents the isochrone used to fit the cluster (see text for details), and the horizontal dotted lines indicate initial MS mass values along the CMD inferred from the isochrone.
Current usage metrics show cumulative count of Article Views (full-text article views including HTML views, PDF and ePub downloads, according to the available data) and Abstracts Views on Vision4Press platform.
Data correspond to usage on the plateform after 2015. The current usage metrics is available 48-96 hours after online publication and is updated daily on week days.
Initial download of the metrics may take a while.