Fig. 12
Download original image
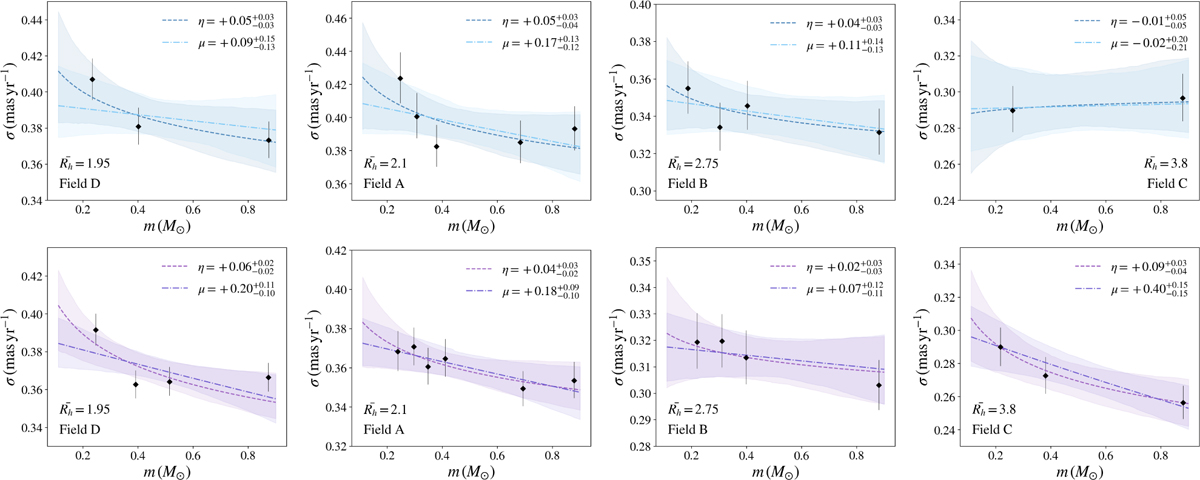
Velocity dispersion as a function of stellar mass for 1G (top panels) and 2G (bottom panels) stars. The labels at the bottom of the plots indicate the average radius in units of half-light radius for stars in each field, and the name of the field. The best-fit values of n and μ are indicated at the top right of each panel. Shaded regions represent the 5th to 95th percentile range of the models.
Current usage metrics show cumulative count of Article Views (full-text article views including HTML views, PDF and ePub downloads, according to the available data) and Abstracts Views on Vision4Press platform.
Data correspond to usage on the plateform after 2015. The current usage metrics is available 48-96 hours after online publication and is updated daily on week days.
Initial download of the metrics may take a while.