Fig. 10
Download original image
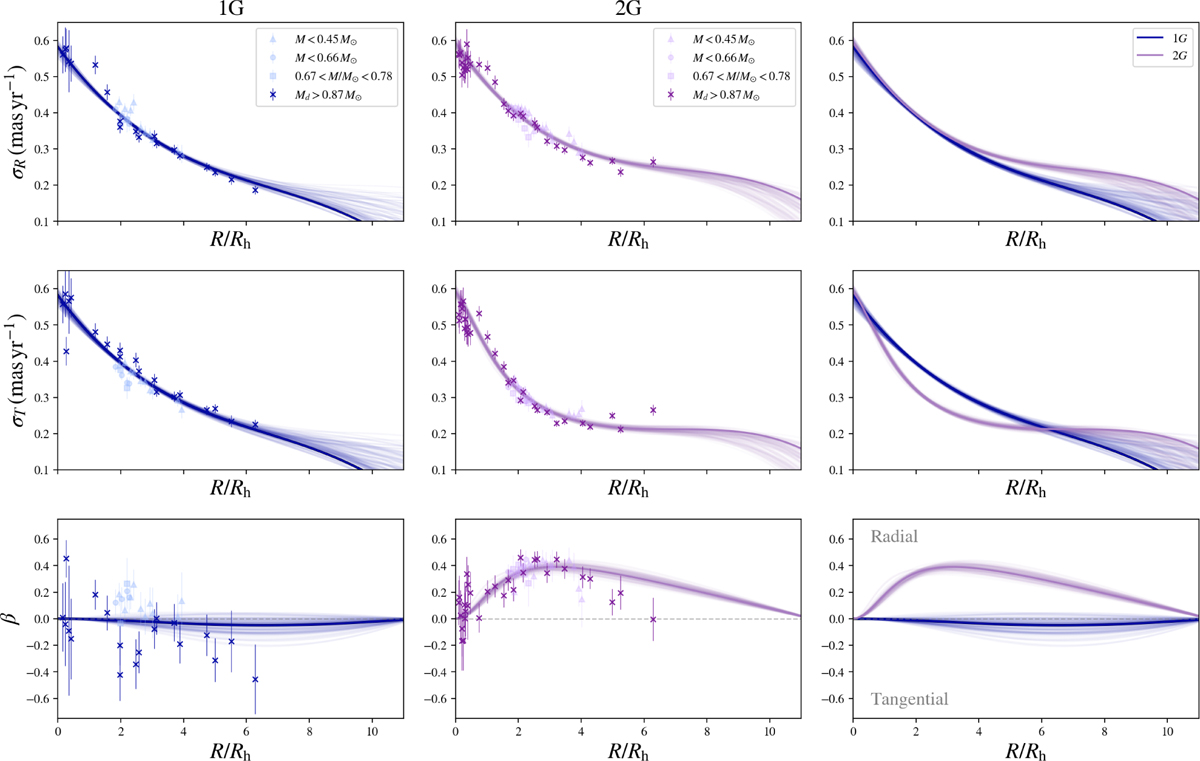
Radial profiles of the velocity dispersion in the radial (top panels) and tangential (middle panels) directions. The bottom panels show the anisotropy profiles, with β = 1 - (σT/σR)2. The 1G observations are represented with blue colors, and 2G with purple colors. The dark blue and purple lines indicate the best-fit models, as discussed in Section 5.4. The light blue and purple lines represent additional model realizations based on sampled parameter sets. The radial coordinate is normalized to the half-light radius, Rh = 3.17 arcmin.
Current usage metrics show cumulative count of Article Views (full-text article views including HTML views, PDF and ePub downloads, according to the available data) and Abstracts Views on Vision4Press platform.
Data correspond to usage on the plateform after 2015. The current usage metrics is available 48-96 hours after online publication and is updated daily on week days.
Initial download of the metrics may take a while.