Open Access
Fig. 8
Download original image
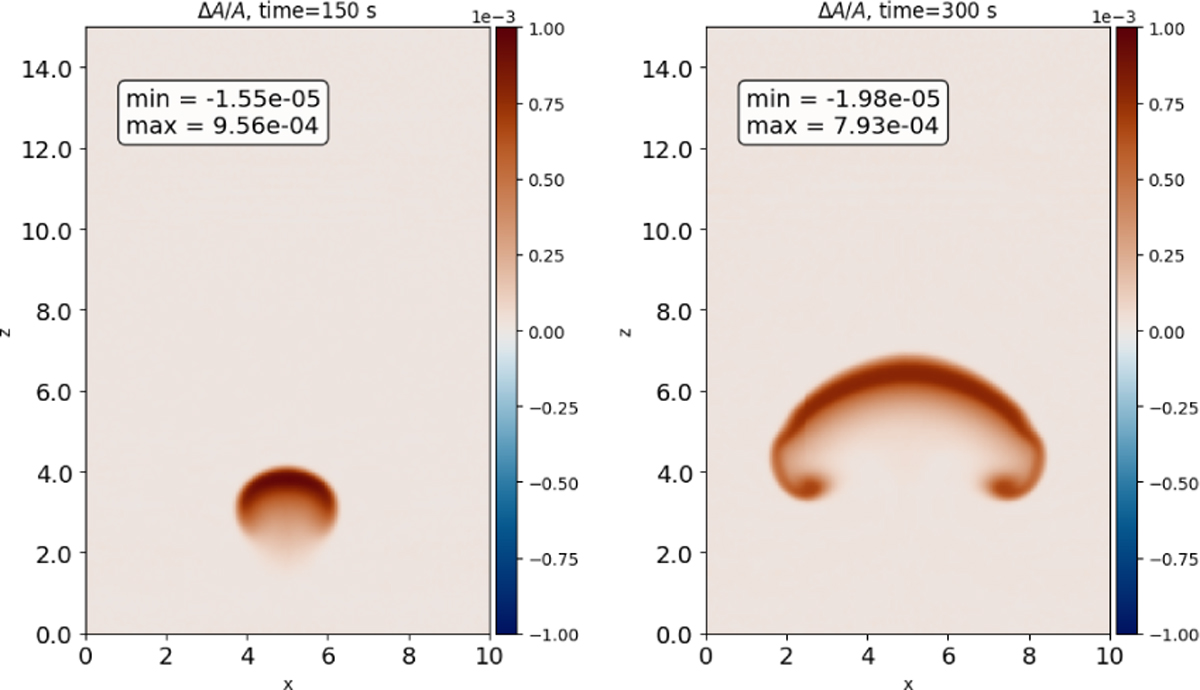
‘Hot-bubble’ experiment at time=150 and 300 s. Both panels show fluctuations of ΔA/A, with the min/max values given in the floating box.
Current usage metrics show cumulative count of Article Views (full-text article views including HTML views, PDF and ePub downloads, according to the available data) and Abstracts Views on Vision4Press platform.
Data correspond to usage on the plateform after 2015. The current usage metrics is available 48-96 hours after online publication and is updated daily on week days.
Initial download of the metrics may take a while.