Open Access
Fig. 3
Download original image
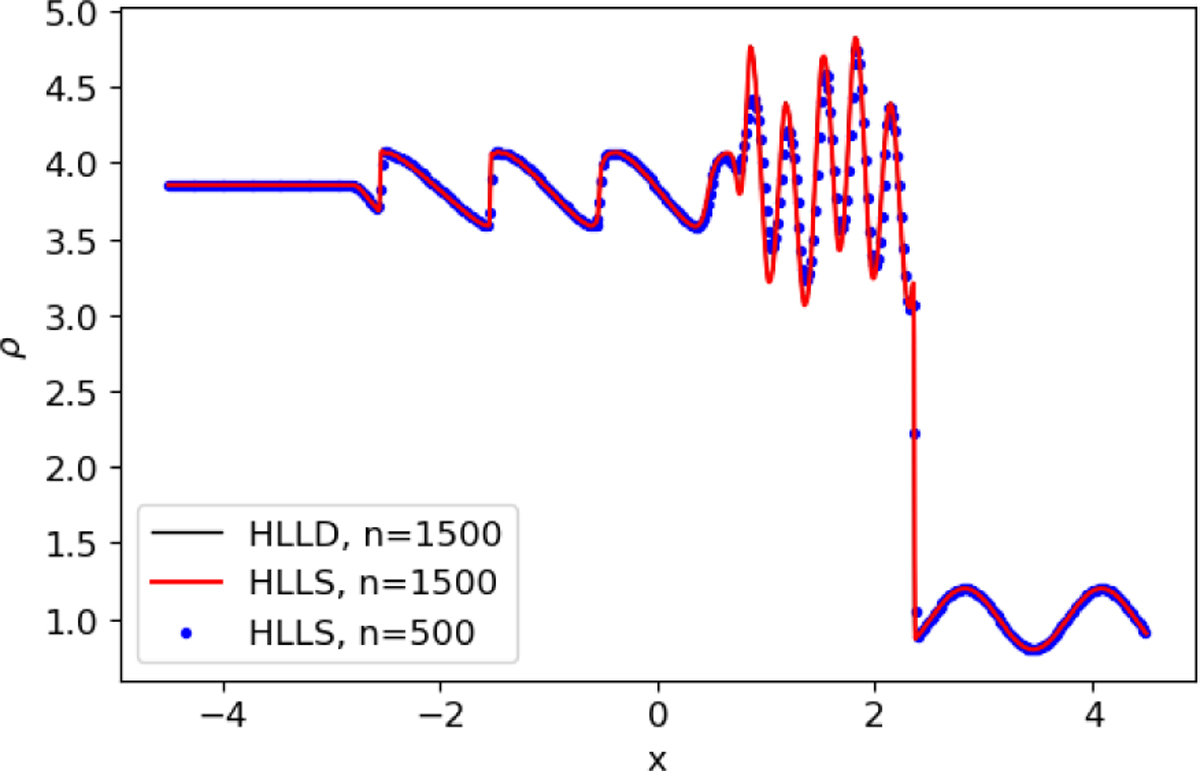
Shu & Osher shock-tube test. Density profile at time=1.8; black: reference HLLD solver with 1500 cells; red: HLLS solver with 1500 cells; blue dots: HLLS solver with 500 cells.
Current usage metrics show cumulative count of Article Views (full-text article views including HTML views, PDF and ePub downloads, according to the available data) and Abstracts Views on Vision4Press platform.
Data correspond to usage on the plateform after 2015. The current usage metrics is available 48-96 hours after online publication and is updated daily on week days.
Initial download of the metrics may take a while.