Fig. 8.
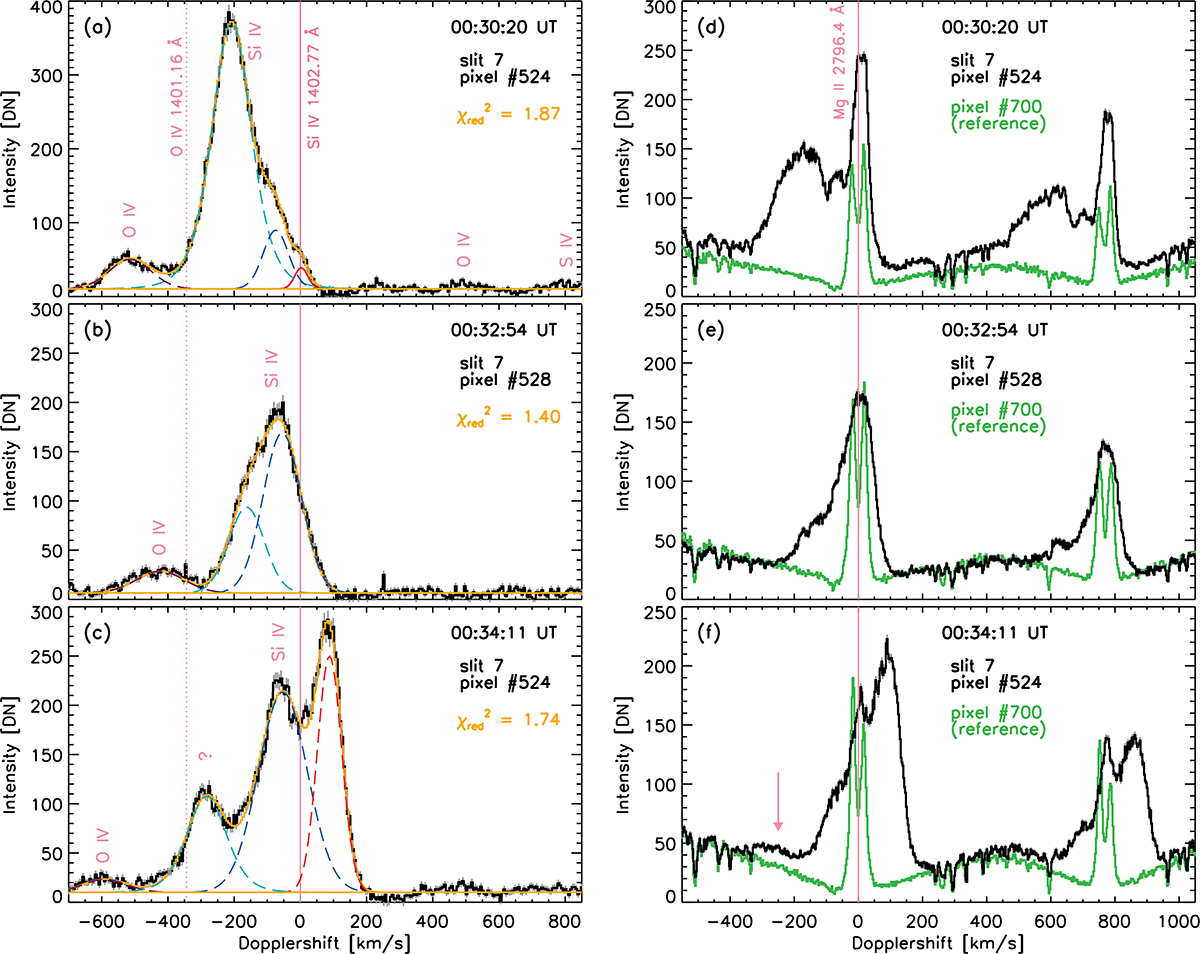
Download original image
Observed IRIS spectra (black) of Si IV (a–c) and Mg II (d–f) at three different times as shown in previous figures (horizontal dashed blue lines in Fig. 7). Uncertainties of the observed spectra are denoted by thin gray error bars. The fit to the Si IV spectra is shown in orange, with individual components indicated by colored lines (blue and red for blueshifted and redshifted components of the Si IV line, violet for O IV line). Reference spectra for Mg II are shown in green, and are taken in the non-flaring chromosphere to the north of the erupting filament. Vertical pink lines denote rest wavelengths for individual spectral lines. At 00:34:11 UT there are several components in both lines, in particular one corresponding to 250 km s−1 (pink arrow in panel f and the “?” sign in panel c). See text for details.
Current usage metrics show cumulative count of Article Views (full-text article views including HTML views, PDF and ePub downloads, according to the available data) and Abstracts Views on Vision4Press platform.
Data correspond to usage on the plateform after 2015. The current usage metrics is available 48-96 hours after online publication and is updated daily on week days.
Initial download of the metrics may take a while.