Fig. 7.
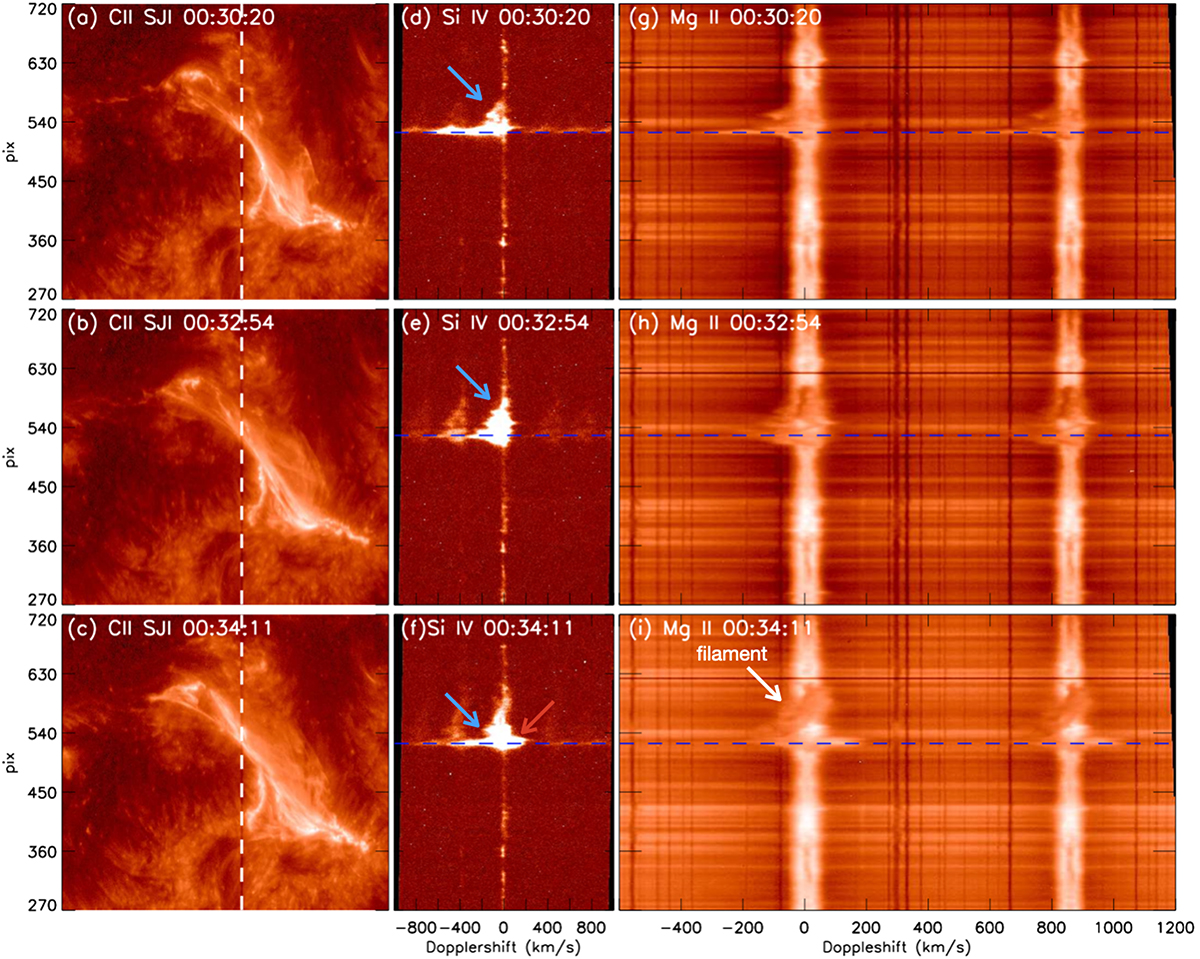
Download original image
Detailed Si IV and Mg II spectra of the three reconnection episodes detected at slit position 7 (see Fig. 6). Panels (a)–(c) show the IRIS/SJI observations in C II, similarly to in Fig. 6, with the position of slit 7 is shown with a vertical dashed white line. Panels (d)–(f) show the Si IV detector images, while panels (g)–(i) show the Mg II ones at this slit position at three different times. The horizontal dashed blue line indicates the reconnecting filament spectra with large Doppler shifts plotted in Fig. 8. The blue and red arrows in panels d-e-f indicate the blueshift and redshift flows during the reconnection in Si IV spectra. The white arrow indicates the filament in panel (i).
Current usage metrics show cumulative count of Article Views (full-text article views including HTML views, PDF and ePub downloads, according to the available data) and Abstracts Views on Vision4Press platform.
Data correspond to usage on the plateform after 2015. The current usage metrics is available 48-96 hours after online publication and is updated daily on week days.
Initial download of the metrics may take a while.