Fig. 6.
Download original image
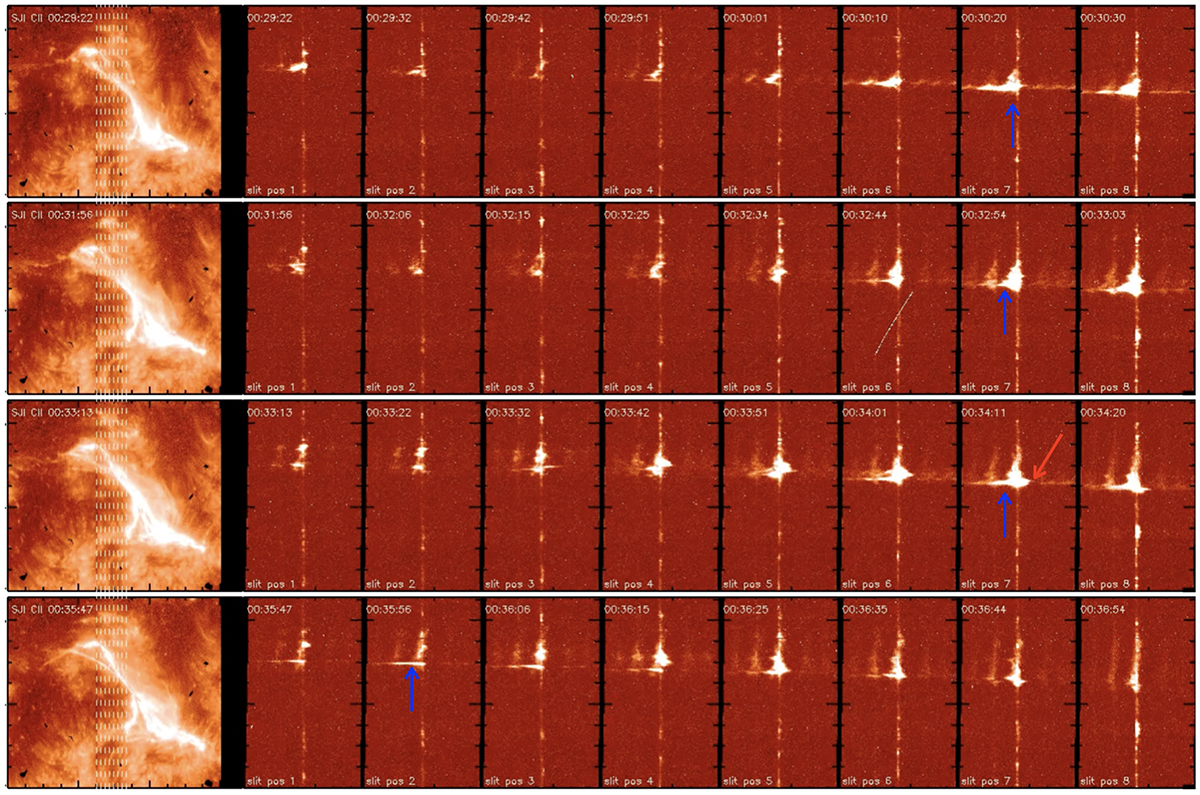
Overview of the Si IV spectra of the reconnecting filament. The left panels show the C II SJI images, overlaid with all eight slit positions as vertical dashed lines. The right panels show the corresponding eight Si IV spectra at each slit position. Prominent enhancements of the Si IV 1402.8 Å line, which can also be Doppler-shifted, are shown by blue and red arrows, respectively. Note the similar behavior of the O IV line at 1401.2 Å. An animation of this figure is available online (SJICII_SpectraSiIV_revised.mp4).
Current usage metrics show cumulative count of Article Views (full-text article views including HTML views, PDF and ePub downloads, according to the available data) and Abstracts Views on Vision4Press platform.
Data correspond to usage on the plateform after 2015. The current usage metrics is available 48-96 hours after online publication and is updated daily on week days.
Initial download of the metrics may take a while.