Fig. 5.
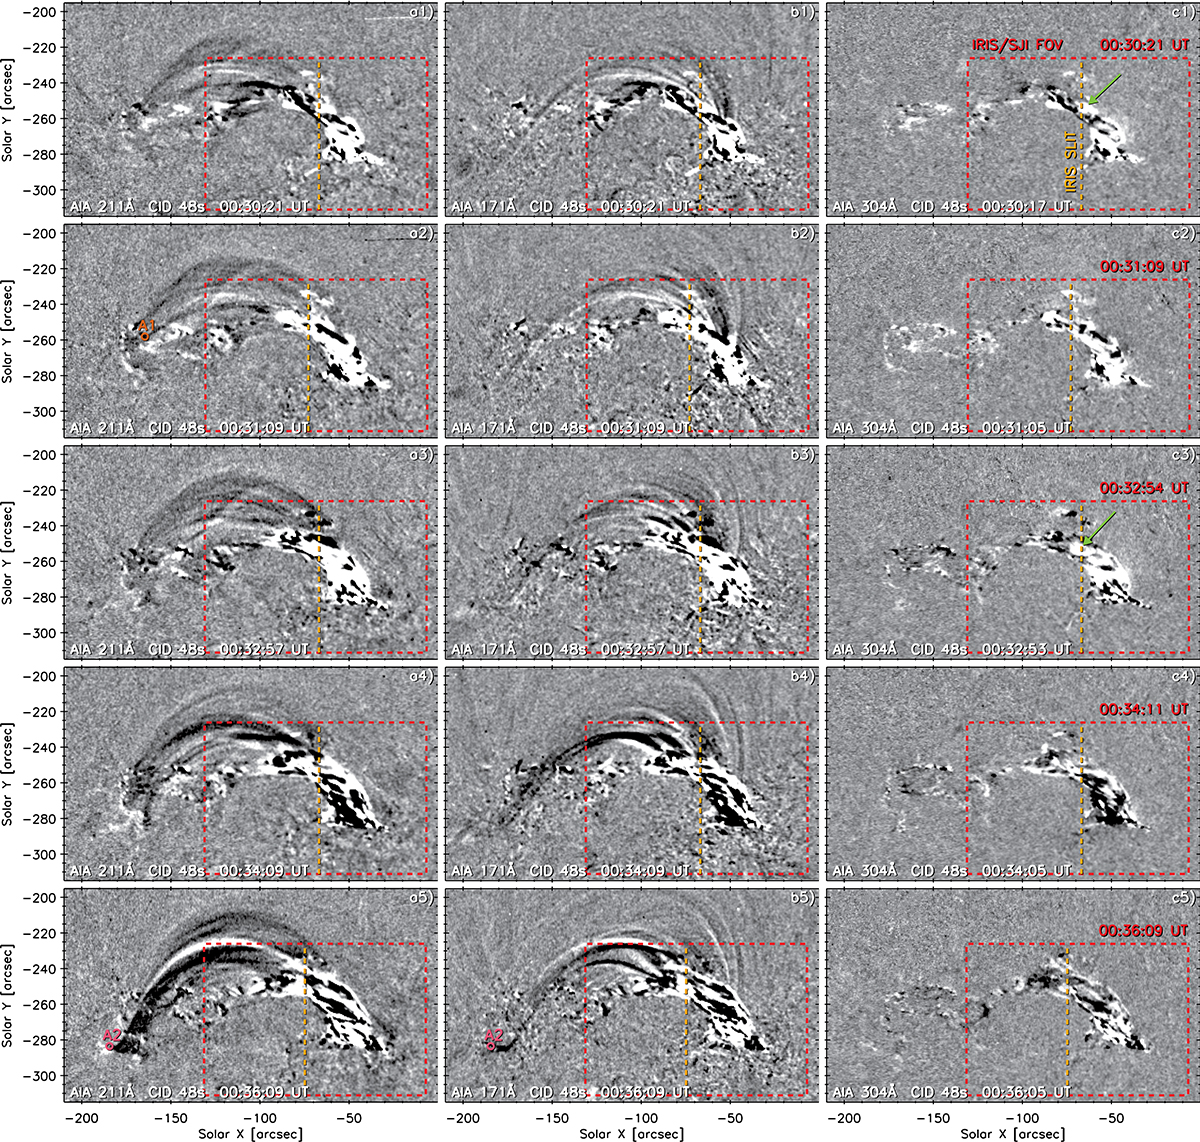
Download original image
Difference images highlighting the evolution of the filament and coronal loops during AR–RF reconnection. The rectangular IRIS/SJI field of view is shown in red, and the position of the IRIS slit in orange. Panels (a1)–(c1), (a3)–(c3), and (a4)–(c4) show times corresponding to the IRIS spectra studied in Sect. 4. Panels (a2)–(c2) and (a5)–(c5) are shown for context, indicating the footpoints of coronal loops (arcades) A1 and A2 that reconnected with the filament. At the respective times, the loops are dark structures, indicating that they no longer exist. Green arrows at 00:30:21 and 00:32:54 UT indicate locations along the IRIS slit where brightenings are observed within the filament. Animations of the CID images are available online (Movie_CID_IRIS.mpg).
Current usage metrics show cumulative count of Article Views (full-text article views including HTML views, PDF and ePub downloads, according to the available data) and Abstracts Views on Vision4Press platform.
Data correspond to usage on the plateform after 2015. The current usage metrics is available 48-96 hours after online publication and is updated daily on week days.
Initial download of the metrics may take a while.