Fig. 2.
Download original image
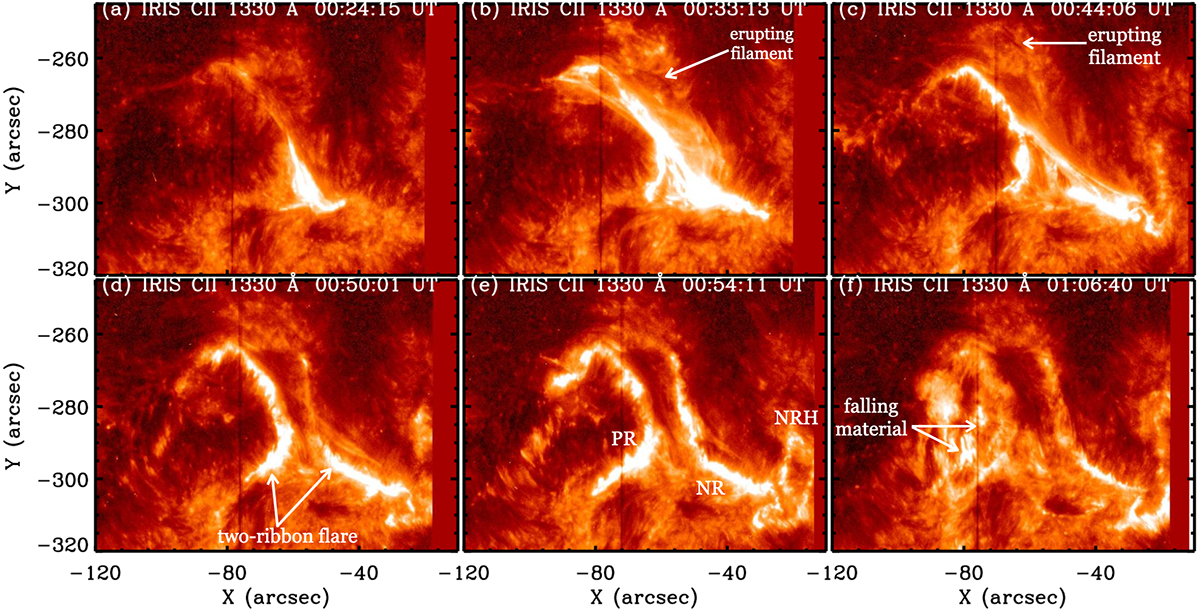
Evolution of flare ribbons and the filament eruption as observed in IRIS C II SJIs is depicted. Panels (b) and (c) highlight the erupting filament, with white arrows indicating the filament’s increasing height over time. Panel (d) presents a clear view of the two ribbons forming in the flare region. In panel (e), the labeling of different ribbon regions is provided, as is described in Sect. 3.2. Finally, panel (f) illustrates the falling-back material during the later stages of the event.
Current usage metrics show cumulative count of Article Views (full-text article views including HTML views, PDF and ePub downloads, according to the available data) and Abstracts Views on Vision4Press platform.
Data correspond to usage on the plateform after 2015. The current usage metrics is available 48-96 hours after online publication and is updated daily on week days.
Initial download of the metrics may take a while.