Fig. 9.
Download original image
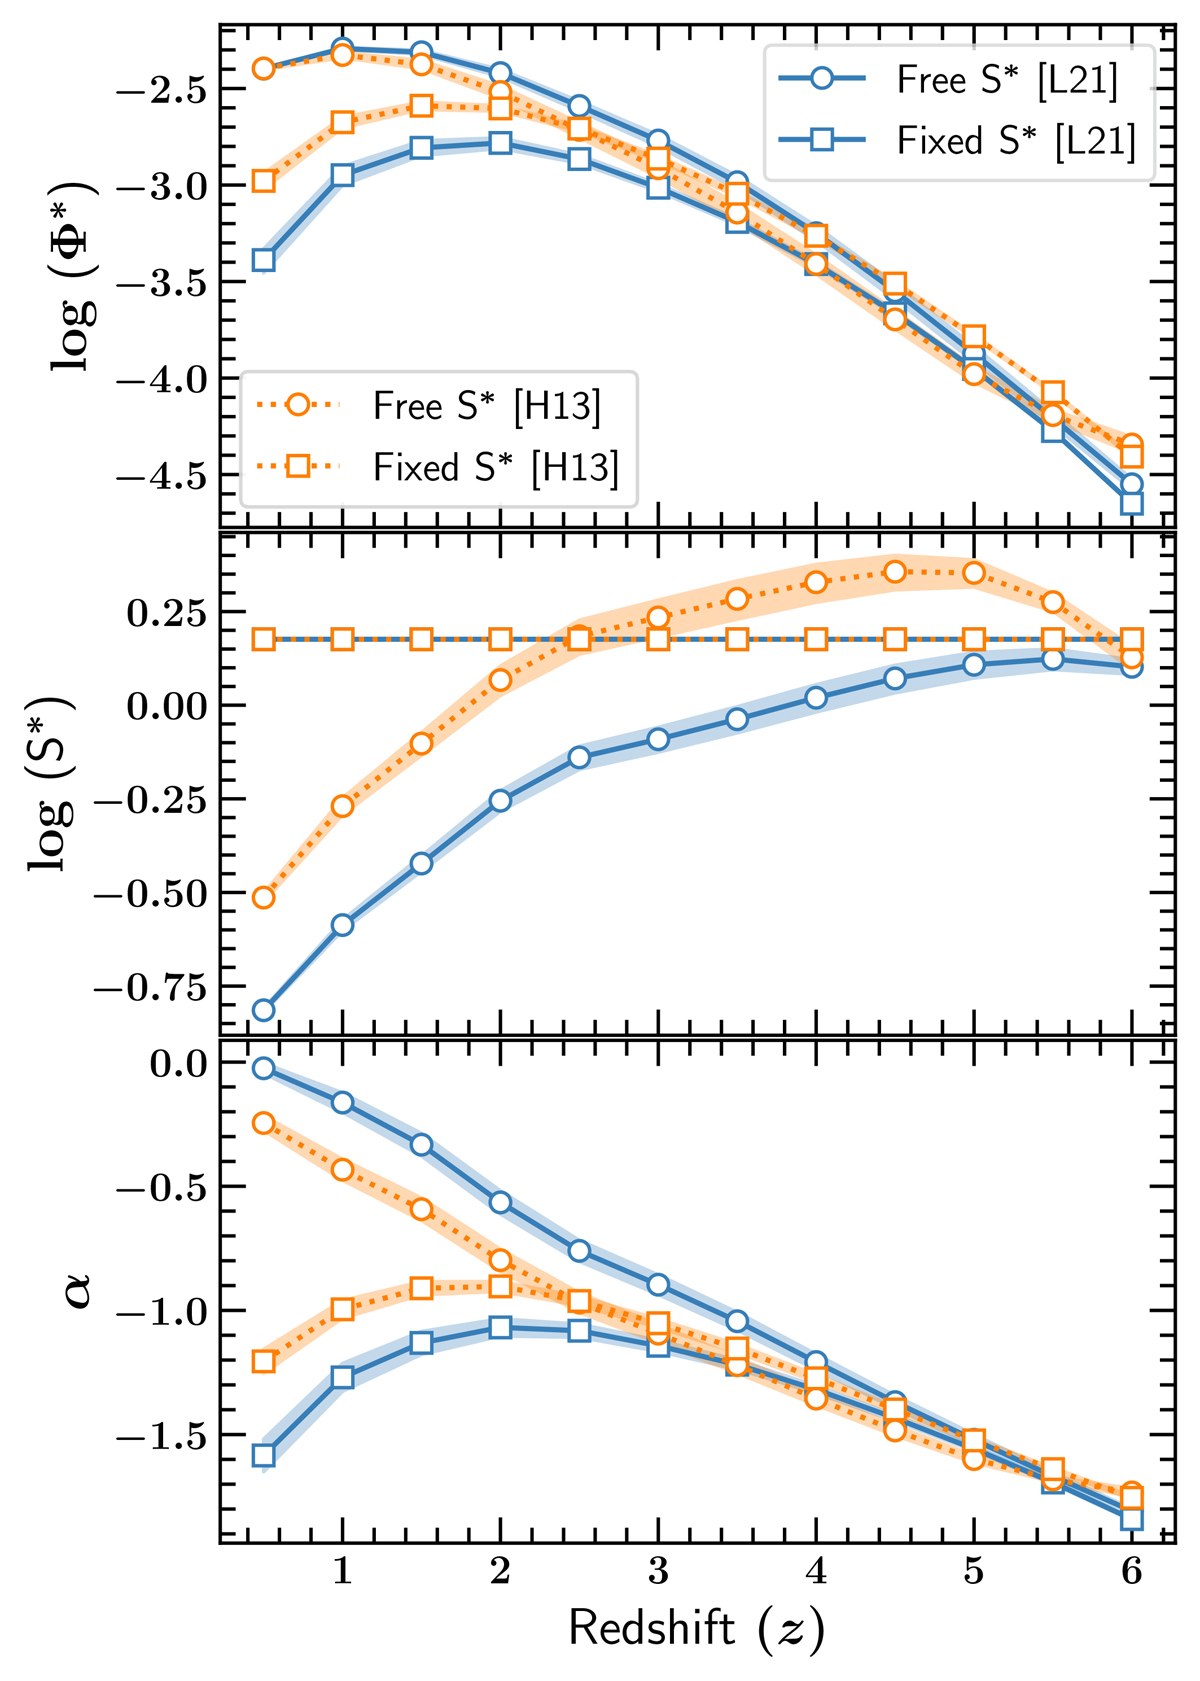
Redshift evolution of the Schechter function fitting parameters for the flux density function shown in Fig. 8. The solid blue and dotted orange curves with circles respectively represent the fitting parameters for the L21 and H13 models. To exhibit the evolution of the flux density functions, we also show the fitting parameters for an arbitrarily fixed value of S* = 1.5 mJy using solid blue and dotted orange curves with boxes for the L21 and H13, respectively. The shaded regions around the curves represent fitting uncertainties.
Current usage metrics show cumulative count of Article Views (full-text article views including HTML views, PDF and ePub downloads, according to the available data) and Abstracts Views on Vision4Press platform.
Data correspond to usage on the plateform after 2015. The current usage metrics is available 48-96 hours after online publication and is updated daily on week days.
Initial download of the metrics may take a while.