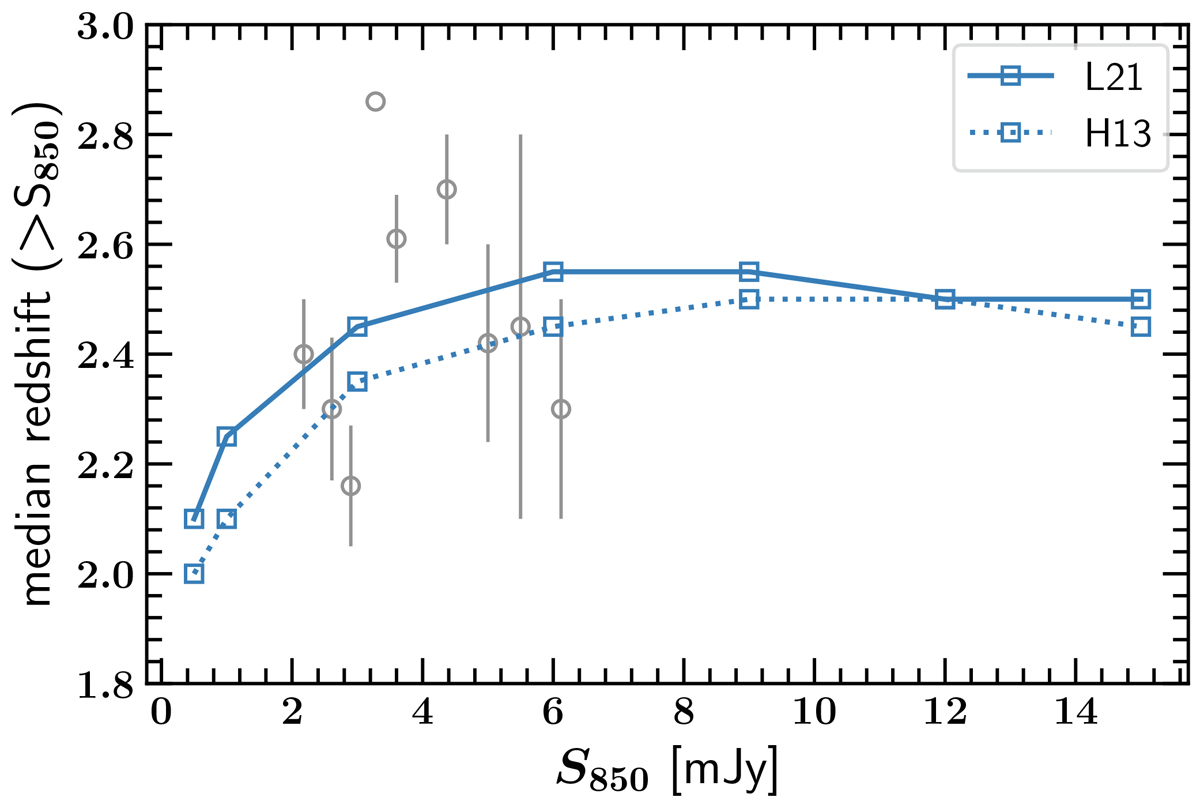
Fig. 4.
Download original image
Median of the redshift distributions of submillimeter galaxies as a function of the flux density cut in the FLAMINGO simulation. The solid blue curve represents the prediction using the L21 relation, and the dotted blue curve shows the prediction assuming the H13 relation. Gray color points represent observational estimates obtained from Chapman et al. (2005), Pope et al. (2005), Wardlow et al. (2011), Casey et al. (2013), da Cunha et al. (2015), Danielson et al. (2017), Miettinen et al. (2017), Cowie et al. (2018), Dudzevičiūtė et al. (2020). Both of the models show consistency with the observations and predict a negligible evolution in the median redshift for S850 > 8 mJy.
Current usage metrics show cumulative count of Article Views (full-text article views including HTML views, PDF and ePub downloads, according to the available data) and Abstracts Views on Vision4Press platform.
Data correspond to usage on the plateform after 2015. The current usage metrics is available 48-96 hours after online publication and is updated daily on week days.
Initial download of the metrics may take a while.