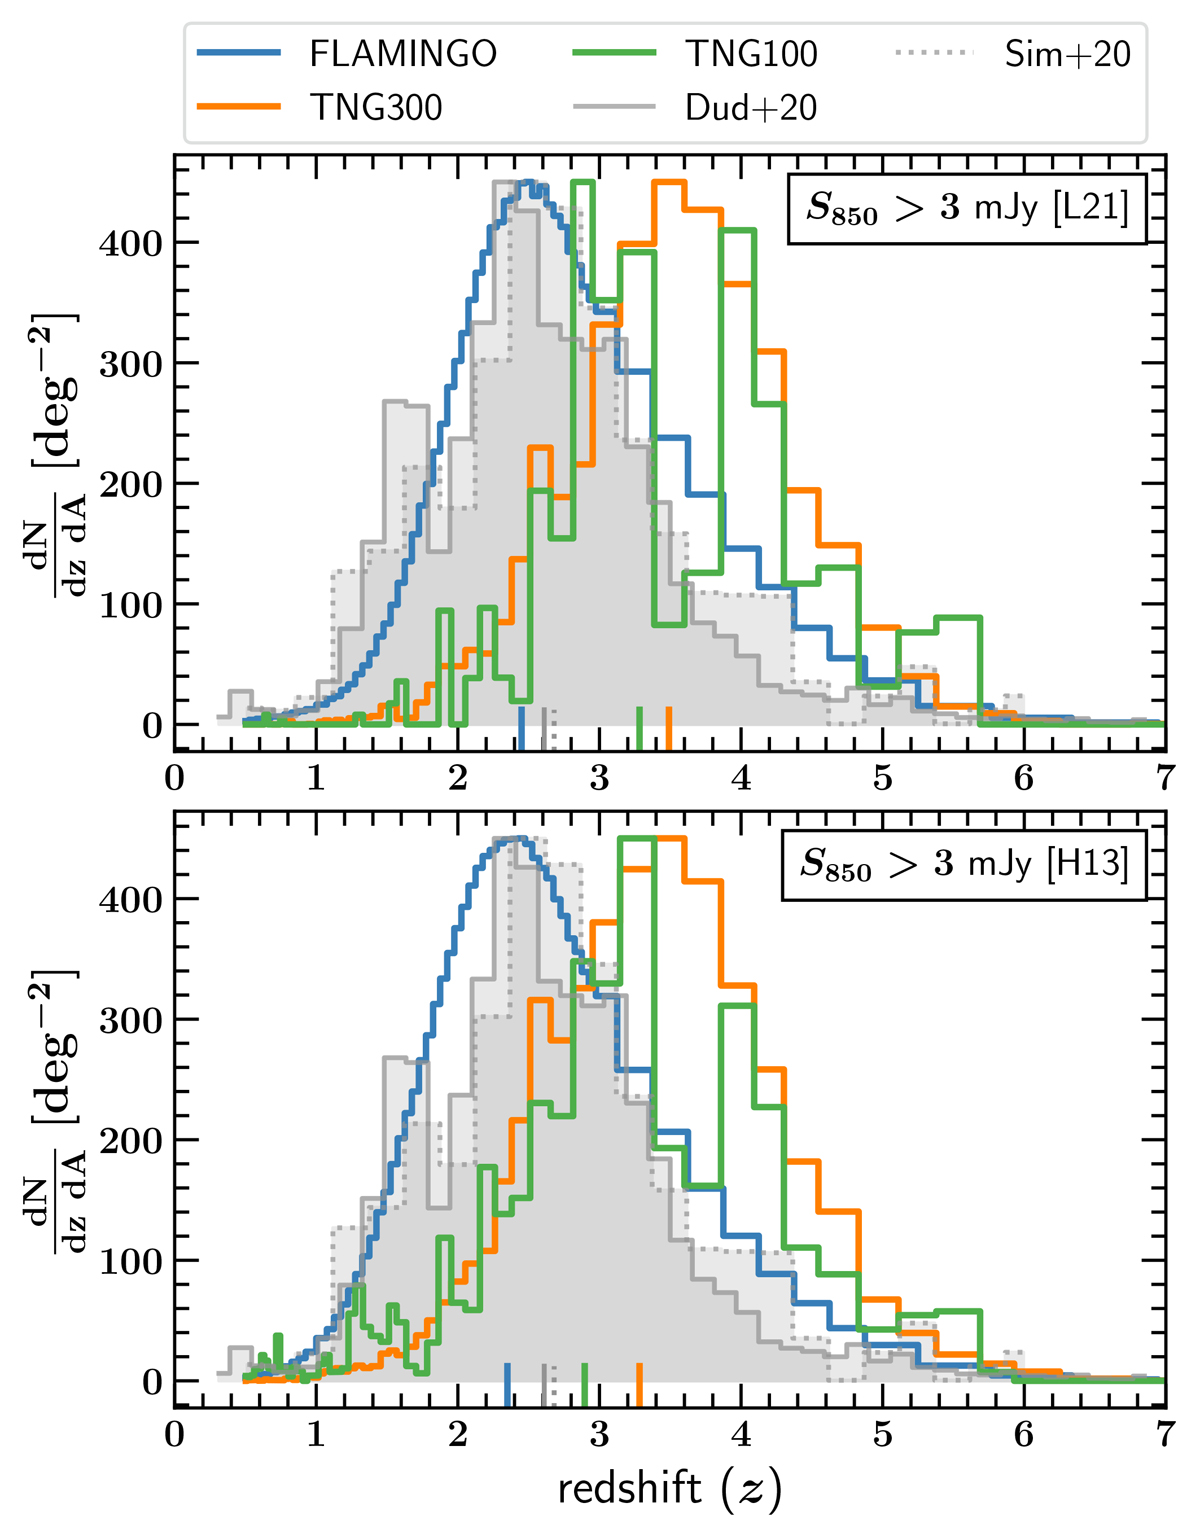
Fig. 3.
Download original image
Redshift distribution of submillimeter-bright galaxies with S850 > 3 mJy in the FLAMINGO (blue), TNG300 (orange), and TNG100 (green) simulations. The gray color histograms represent recent observational estimates from Dudzevičiūtė et al. (2020) [Dud+20], and Simpson et al. (2020) [Sim+20]. All the distributions have been re-scaled to match the height of the Dudzevičiūtė et al. (2020) distribution. The small bars at the bottom of each panel indicate the medians of the respective distributions. The top panel shows predictions assuming the L21 relation, while the bottom panel is for the H13 relation. Quantitatively, FLAMINGO better reproduces the observed distribution for the H13 relation (see Section 4.1 for more details).
Current usage metrics show cumulative count of Article Views (full-text article views including HTML views, PDF and ePub downloads, according to the available data) and Abstracts Views on Vision4Press platform.
Data correspond to usage on the plateform after 2015. The current usage metrics is available 48-96 hours after online publication and is updated daily on week days.
Initial download of the metrics may take a while.