Fig. 2.
Download original image
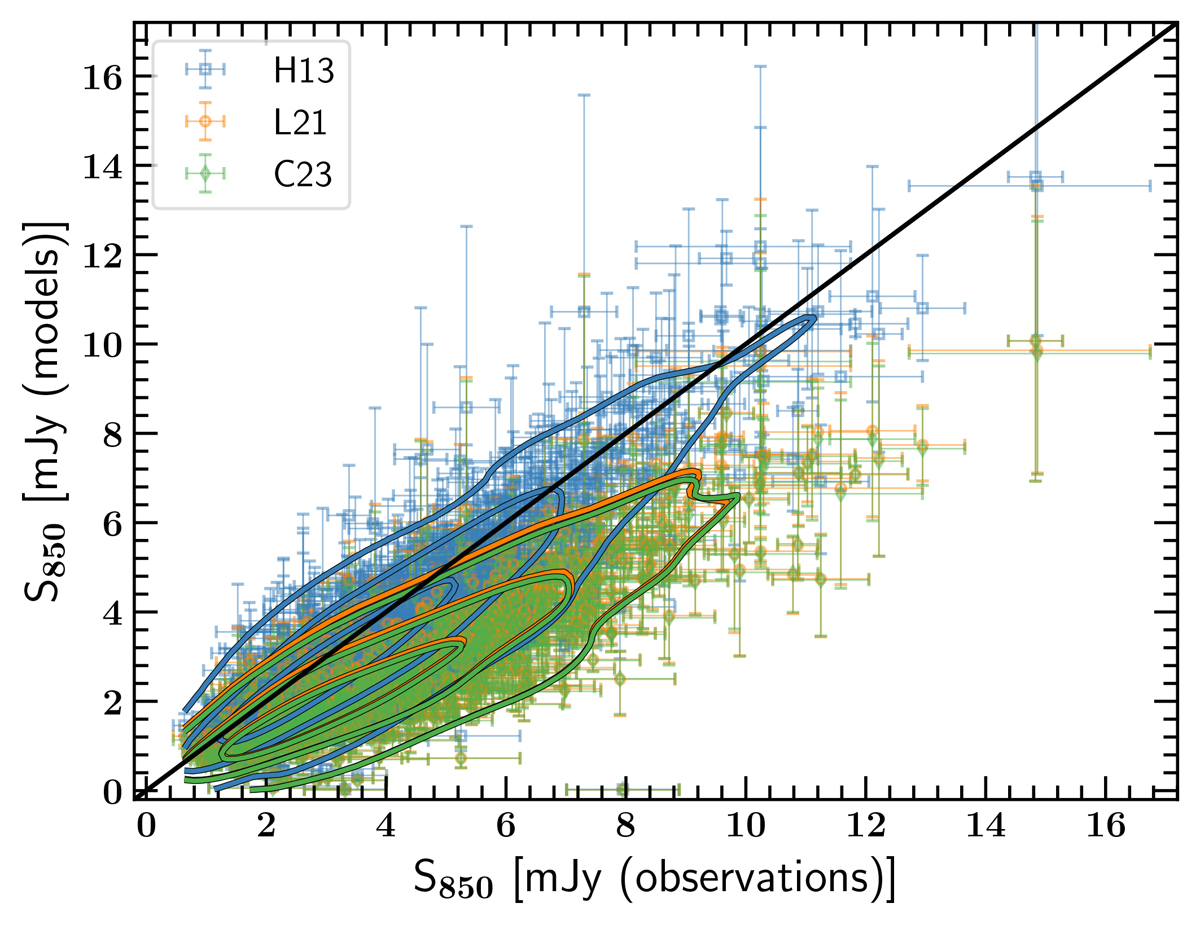
Comparison of observed flux densities with flux densities predicted using the parametric relations listed in Table 2 and observed SFRs and dust masses. The boxes in blue, circles in orange, and diamonds in green respectively represent the H13, L21, and C23 relations. The black solid line is the line of equality for visual guidance. It is clear that H13 reproduces the observed fluxes better than the L21 and C23. (See Section 3.2.2 for more details).
Current usage metrics show cumulative count of Article Views (full-text article views including HTML views, PDF and ePub downloads, according to the available data) and Abstracts Views on Vision4Press platform.
Data correspond to usage on the plateform after 2015. The current usage metrics is available 48-96 hours after online publication and is updated daily on week days.
Initial download of the metrics may take a while.