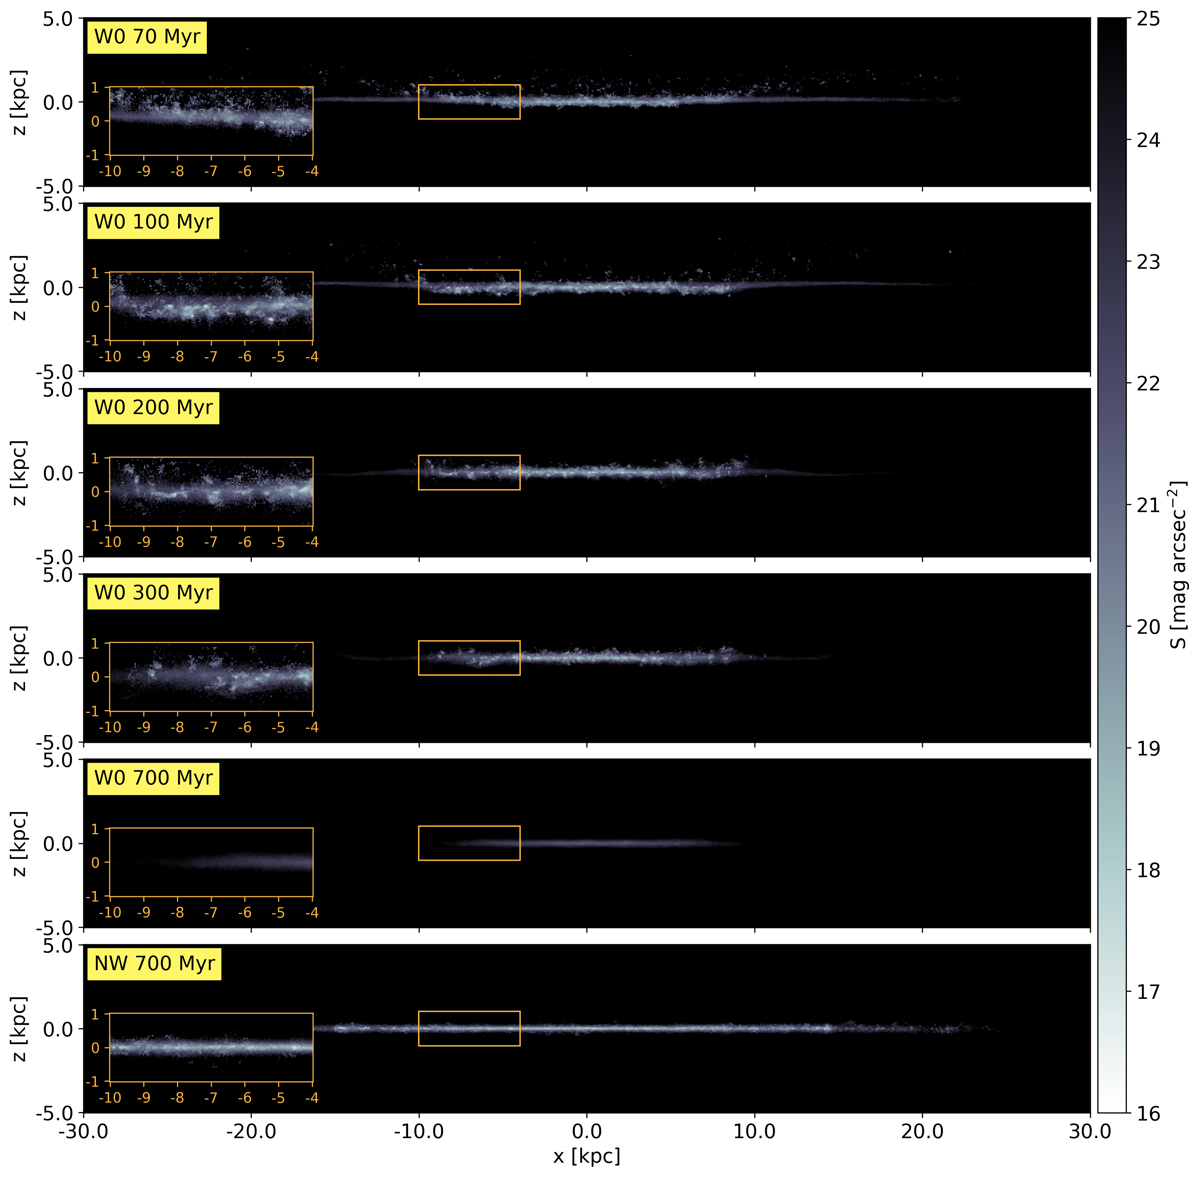
Fig. 6.
Download original image
Same as Fig. 5 but for different galaxies. The top four panels are for W0 at 70, 100, 200, 300, and 700 Myr, from top to bottom. The bottom panel is for the NW galaxy at 700 Myr. The embedded boxes zoom in on the same region in each galaxy. As RPS proceeds, W0 slowly quenches its star formation, and its disc shrinks compared to the NW galaxy.
Current usage metrics show cumulative count of Article Views (full-text article views including HTML views, PDF and ePub downloads, according to the available data) and Abstracts Views on Vision4Press platform.
Data correspond to usage on the plateform after 2015. The current usage metrics is available 48-96 hours after online publication and is updated daily on week days.
Initial download of the metrics may take a while.