Fig. 9.
Download original image
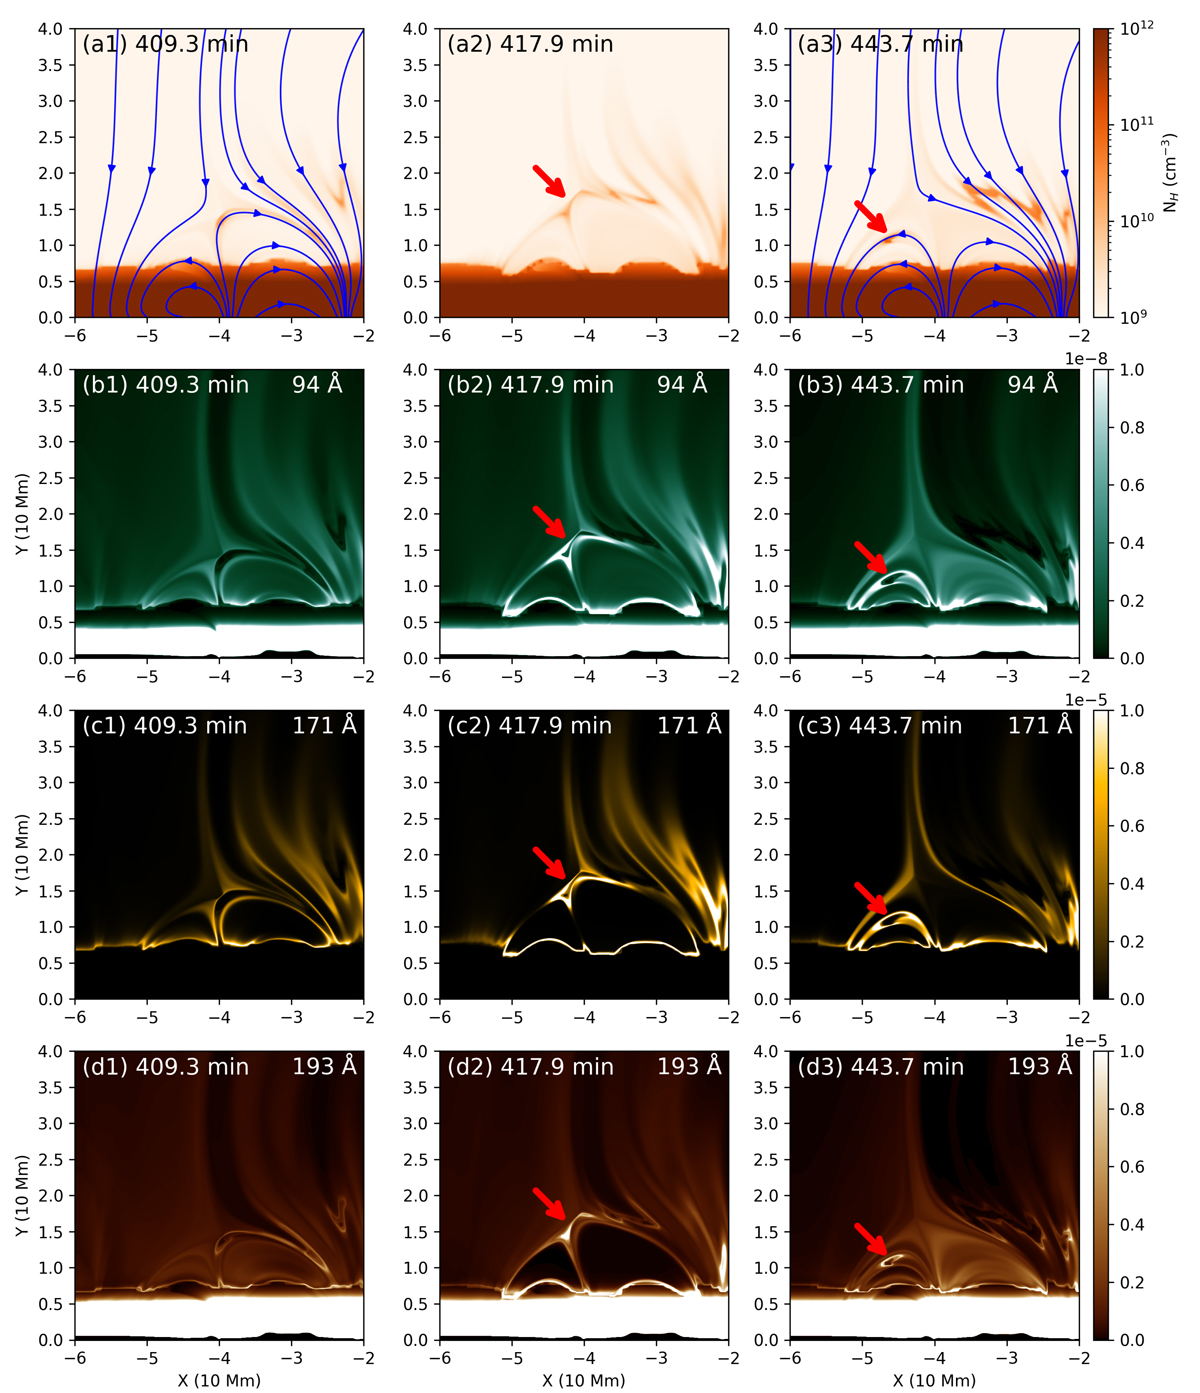
Number density maps and AIA 94 Å, 171 Å, and 193 Å synthetic images of magnetic reconnection. The blue curves in panels (a1) and (a3) denote the magnetic field lines. The red arrows in the middle-column panels indicate the location of the current sheet, while those in the right-column panels denote the condensation in the newly formed magnetic loop.
Current usage metrics show cumulative count of Article Views (full-text article views including HTML views, PDF and ePub downloads, according to the available data) and Abstracts Views on Vision4Press platform.
Data correspond to usage on the plateform after 2015. The current usage metrics is available 48-96 hours after online publication and is updated daily on week days.
Initial download of the metrics may take a while.