Fig. 7.
Download original image
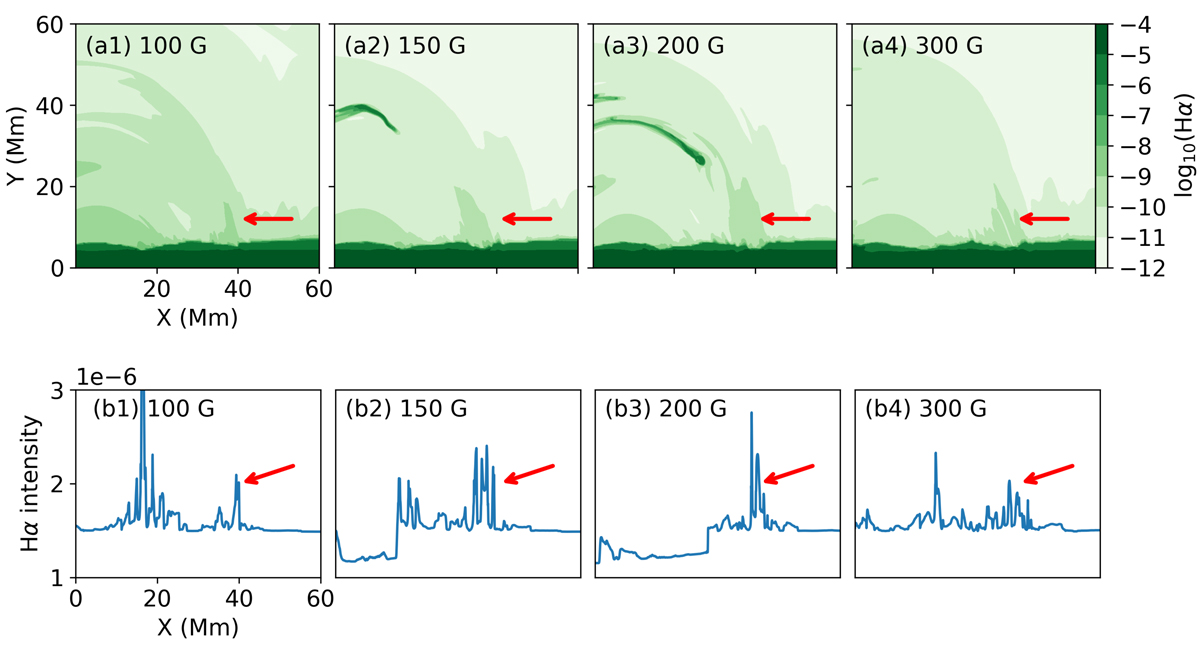
Hα synthetic images and intensity curves (from the top view) displaying the response of chromosphere and TR to the hot jet with different emerging field strengths. The times for different field strength cases (from left to right: 250.5 min, 237.6 min, 233.3 min, and 224.7 min) were chosen as exactly when the hot components reached the TR. The red arrows point to the brightenings.
Current usage metrics show cumulative count of Article Views (full-text article views including HTML views, PDF and ePub downloads, according to the available data) and Abstracts Views on Vision4Press platform.
Data correspond to usage on the plateform after 2015. The current usage metrics is available 48-96 hours after online publication and is updated daily on week days.
Initial download of the metrics may take a while.