Open Access
Fig. 6.
Download original image
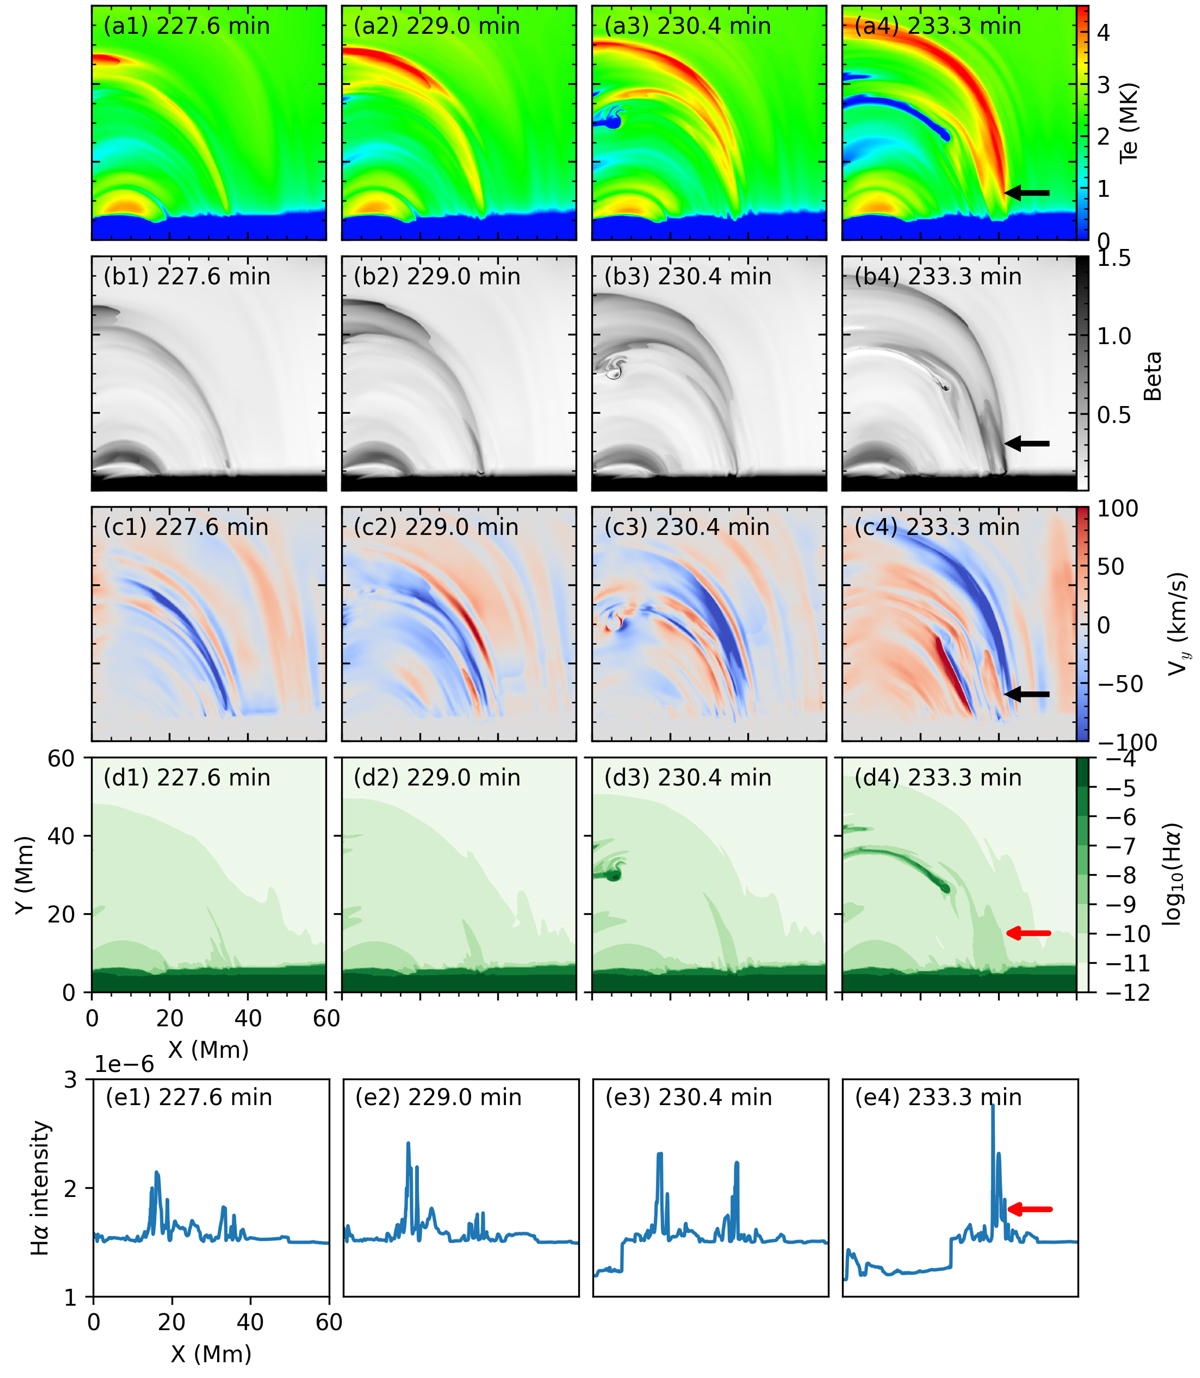
Temperature, plasma β, y-direction velocity, Hα synthetic images, and Hα intensity curves (from the top view) displaying the response of chromosphere and TR to the hot jet during case B1 = 200 G. The arrows in the right panels indicate the backflow.
Current usage metrics show cumulative count of Article Views (full-text article views including HTML views, PDF and ePub downloads, according to the available data) and Abstracts Views on Vision4Press platform.
Data correspond to usage on the plateform after 2015. The current usage metrics is available 48-96 hours after online publication and is updated daily on week days.
Initial download of the metrics may take a while.