Open Access
Fig. 2.
Download original image
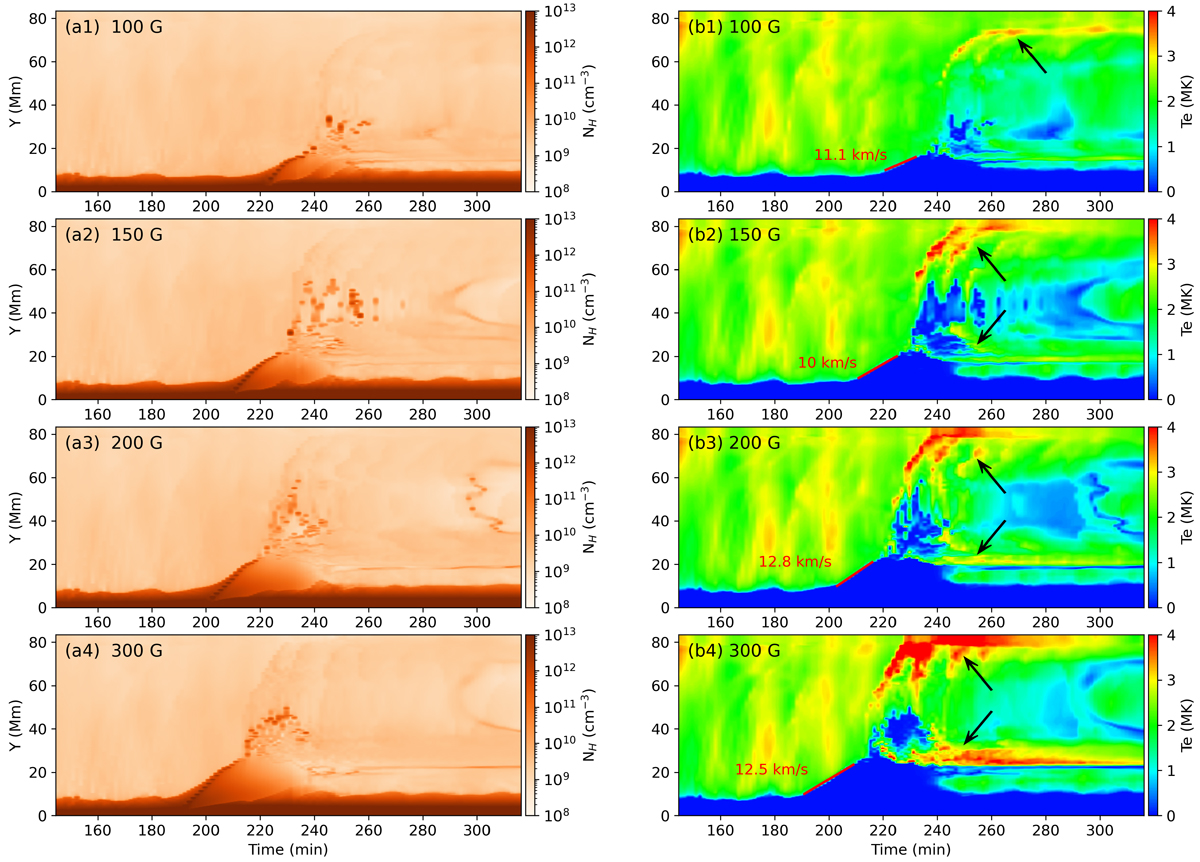
Time evolution of number density (panels (a1)−(a4)) and temperature (panels (b1)−(b4)) along the slice in Fig.1(d) with different emerging field strengths. The black arrows in the right panels denote high-temperature regions formed because of heating.
Current usage metrics show cumulative count of Article Views (full-text article views including HTML views, PDF and ePub downloads, according to the available data) and Abstracts Views on Vision4Press platform.
Data correspond to usage on the plateform after 2015. The current usage metrics is available 48-96 hours after online publication and is updated daily on week days.
Initial download of the metrics may take a while.