Open Access
Fig. 13.
Download original image
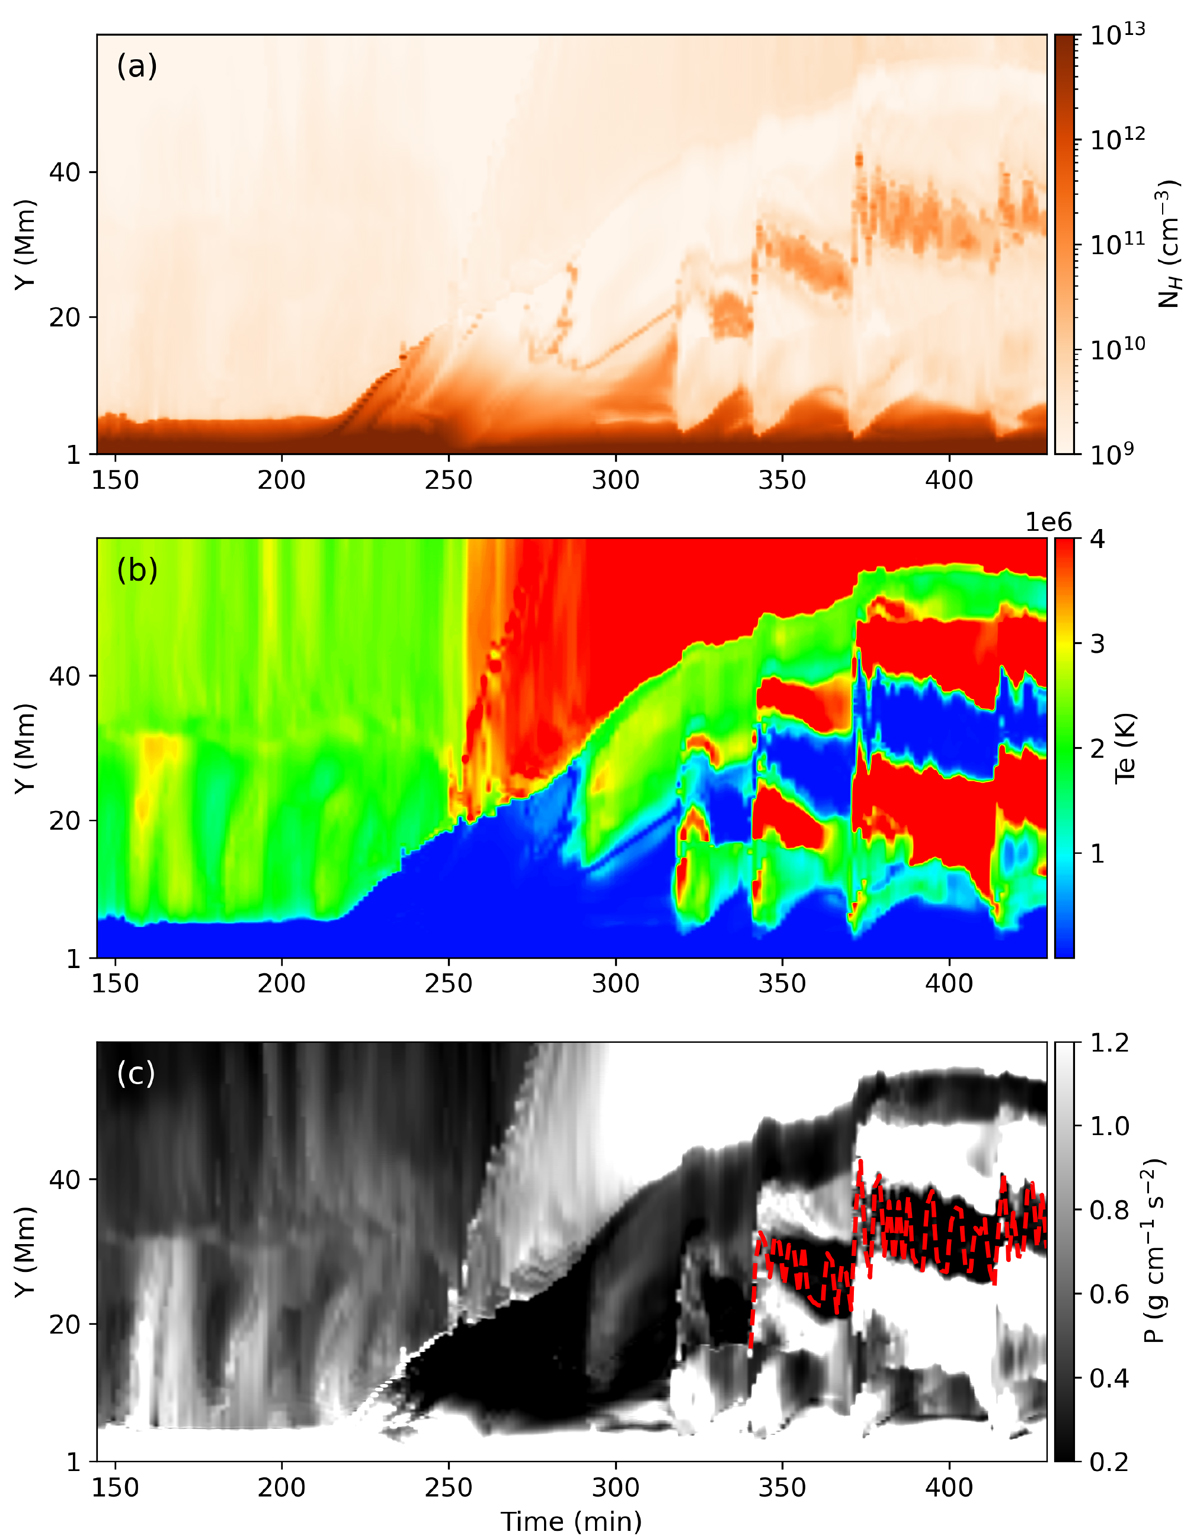
Time evolution of the density, temperature, and thermal pressure along the slice in Fig. 11 when the relative angle is 90°. The dashed red curves in panel (c) show the core of the prominence where the number density is the highest.
Current usage metrics show cumulative count of Article Views (full-text article views including HTML views, PDF and ePub downloads, according to the available data) and Abstracts Views on Vision4Press platform.
Data correspond to usage on the plateform after 2015. The current usage metrics is available 48-96 hours after online publication and is updated daily on week days.
Initial download of the metrics may take a while.