Fig. 9
Download original image
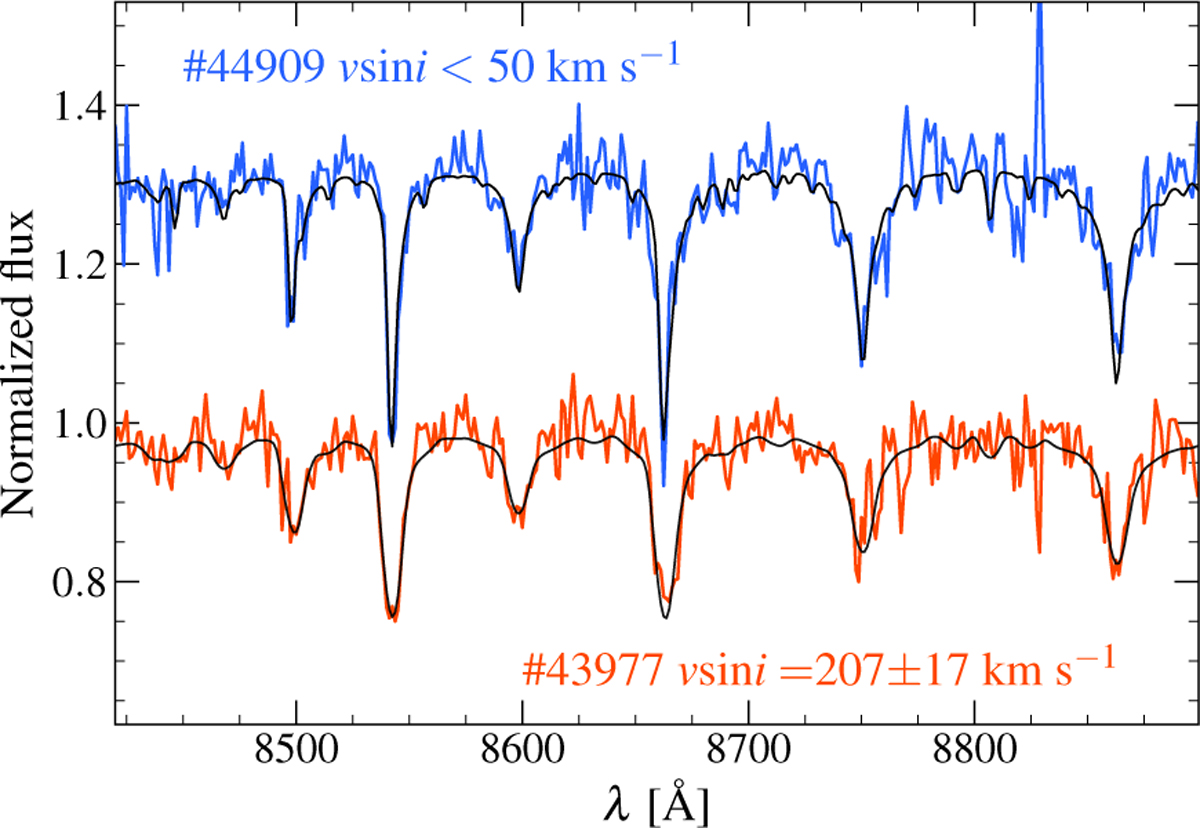
Comparison of MUSE spectra in the Ca II region of two eMSTO stars with a low value of vsini (target #44909, blue curve), consistent with no or slow rotation, and a high rotational velocity (target #43977, red curve). For both spectra, the black curves show the respective best-fit synthetic models. Note that the blue and red spectra are the same as those shown in Fig. 8, and correspond to the targets marked by the star symbols in Fig. 7, using the same color code.
Current usage metrics show cumulative count of Article Views (full-text article views including HTML views, PDF and ePub downloads, according to the available data) and Abstracts Views on Vision4Press platform.
Data correspond to usage on the plateform after 2015. The current usage metrics is available 48-96 hours after online publication and is updated daily on week days.
Initial download of the metrics may take a while.