Fig. 8
Download original image
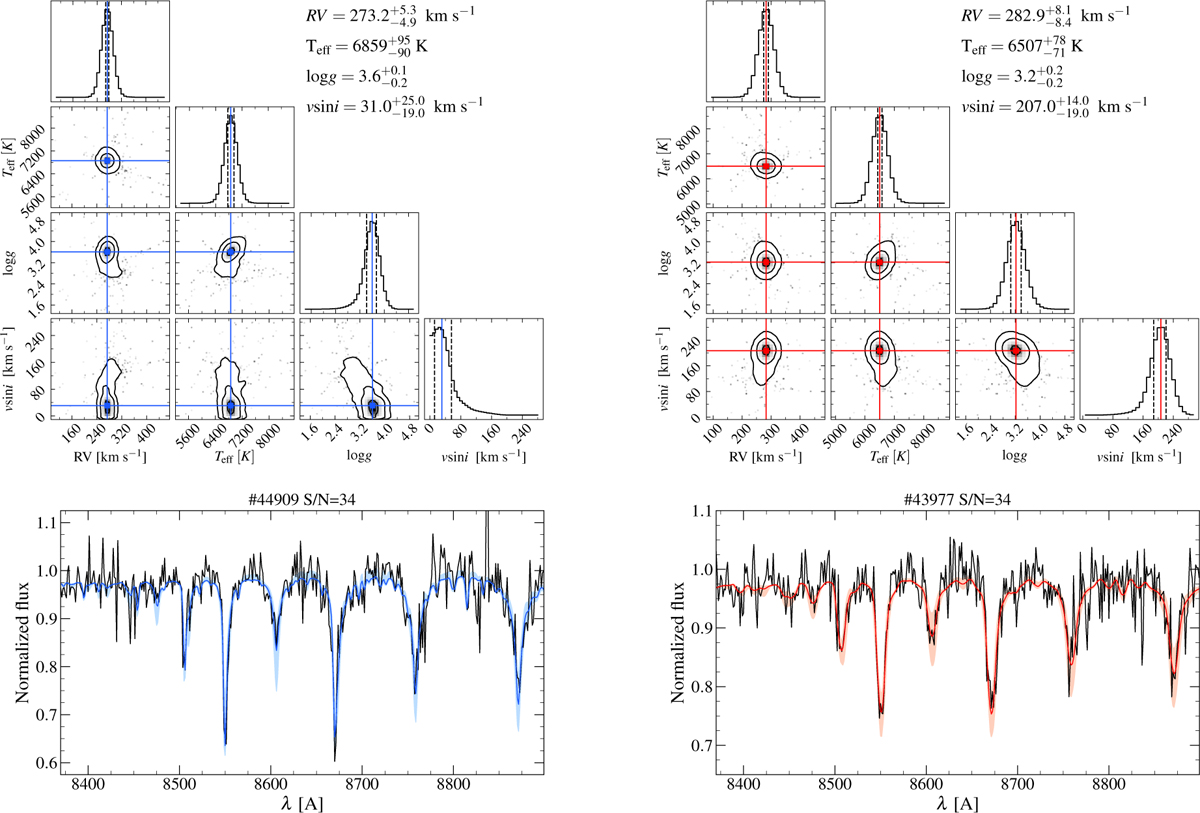
Results of the spectral fitting procedure for the target #44909 on the left panels and the target #43977 on the right panels. Top panels: corner plots showing the one- and two-dimensional posterior probability distributions for all the parameters derived from the MCMC algorithm. The contours correspond to the 68%, 95%, and 99% confidence levels, and the best-fit parameter values are also labeled. Bottom panels: the black curves are the observed MUSE spectra in the Ca II wavelength region, plotted together with the corresponding best-fit synthetic models shown by the solid blue and red curves for the targets #44909 and #43977, respectively. The shaded blue and red regions represent the solutions within the 1σ confidence level.
Current usage metrics show cumulative count of Article Views (full-text article views including HTML views, PDF and ePub downloads, according to the available data) and Abstracts Views on Vision4Press platform.
Data correspond to usage on the plateform after 2015. The current usage metrics is available 48-96 hours after online publication and is updated daily on week days.
Initial download of the metrics may take a while.