Fig. 5
Download original image
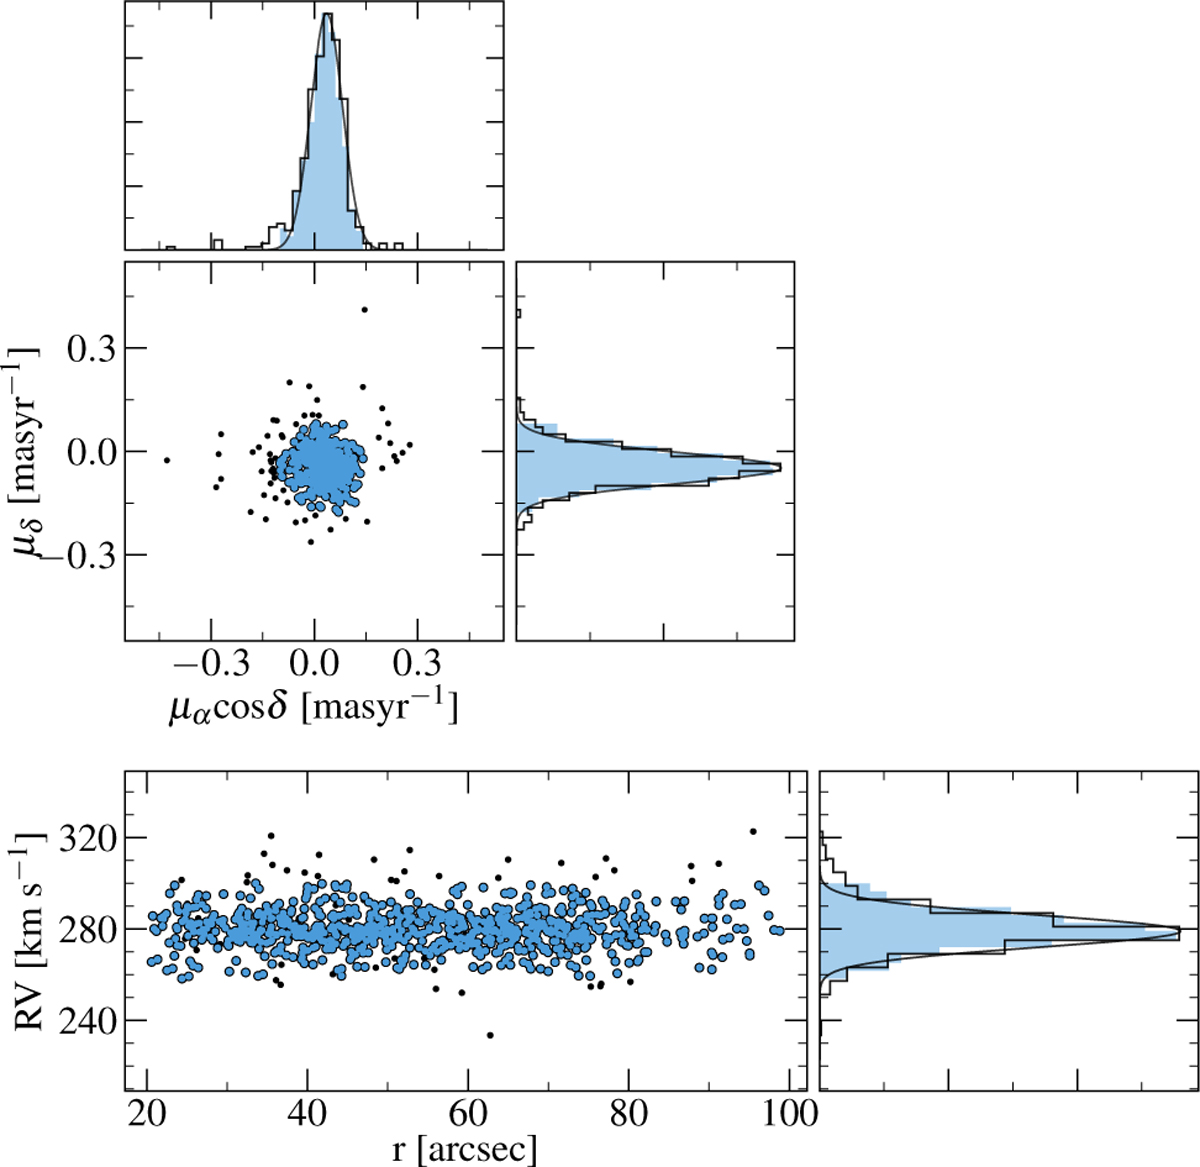
Top panels: VPD of NGC 1783 based on the PM measurements by Cadelano et al. (2022). The blue circles show the MUSE targets selected as likely cluster’s member stars, while the black circles are the MUSE targets classified as non-members. The smaller panels at the top and on the right show the distributions of both the PM components: the empty histograms represent the entire MUSE sample with the corresponding Gaussian fit indicated by the black curves, while the blue histograms are relative to the bona fide cluster members. Bottom panels: distribution of the RVs of the MUSE sample with S/N > 15. The left panel shows the RVs as a function of the distance from the cluster center. The blue circles highlight the bona fide sample selected according to the criteria discussed in the Section 5, while the black dots are the excluded targets. The empty histogram on the left panel shows the number distribution of the entire RV sample, while the blue histogram corresponds to the final subsample of bona fide stars.
Current usage metrics show cumulative count of Article Views (full-text article views including HTML views, PDF and ePub downloads, according to the available data) and Abstracts Views on Vision4Press platform.
Data correspond to usage on the plateform after 2015. The current usage metrics is available 48-96 hours after online publication and is updated daily on week days.
Initial download of the metrics may take a while.