Open Access
Fig. 3
Download original image
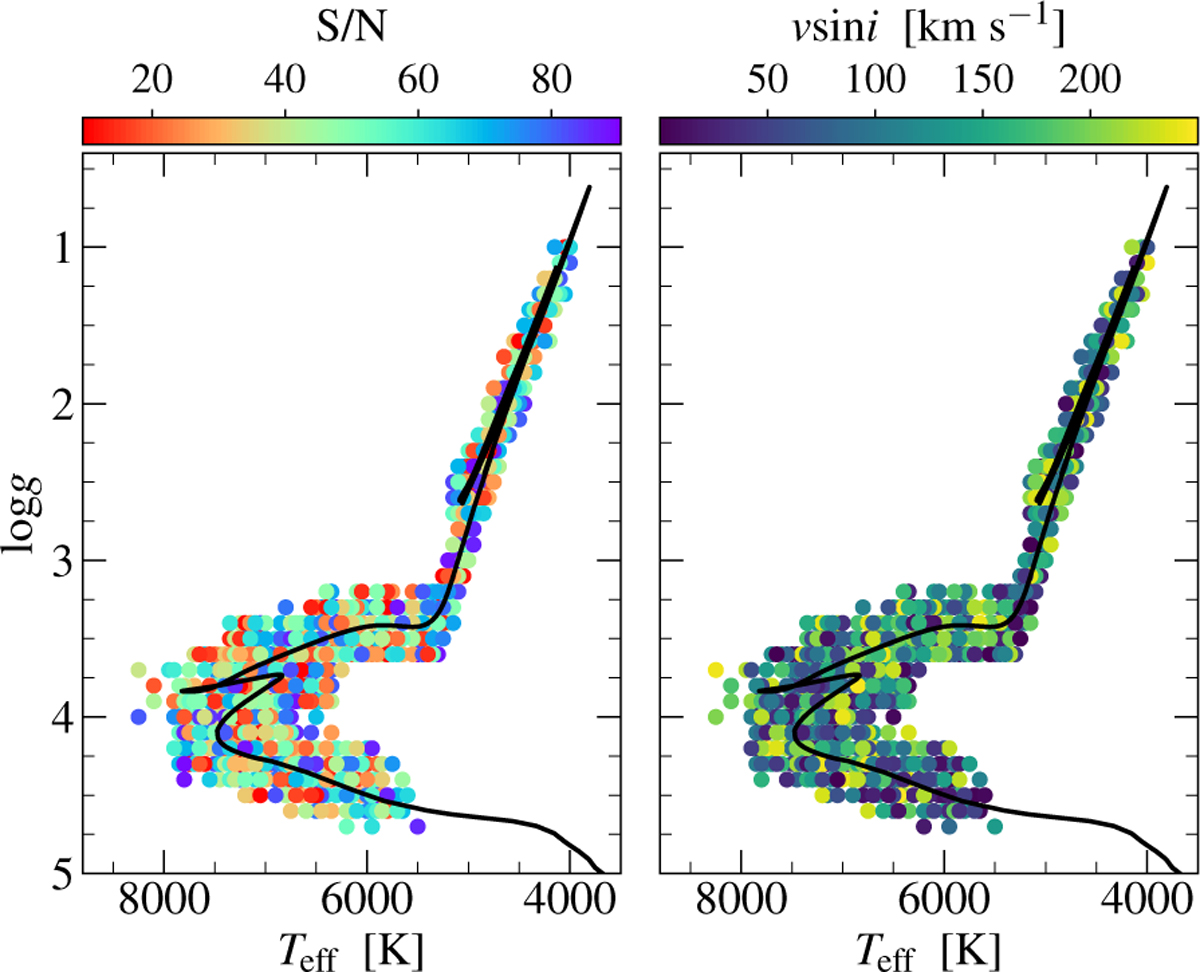
Position of the simulated targets (large circles) in the log g–Teff plane. The circles are color-coded according to the S/N and rotational velocity (vsini) of the simulated spectra in the left and right panels, respectively. The black curve is the isochrone computed for a stellar population of 1.5 Gyr and [Fe/H] = −0.35.
Current usage metrics show cumulative count of Article Views (full-text article views including HTML views, PDF and ePub downloads, according to the available data) and Abstracts Views on Vision4Press platform.
Data correspond to usage on the plateform after 2015. The current usage metrics is available 48-96 hours after online publication and is updated daily on week days.
Initial download of the metrics may take a while.