Fig. 14
Download original image
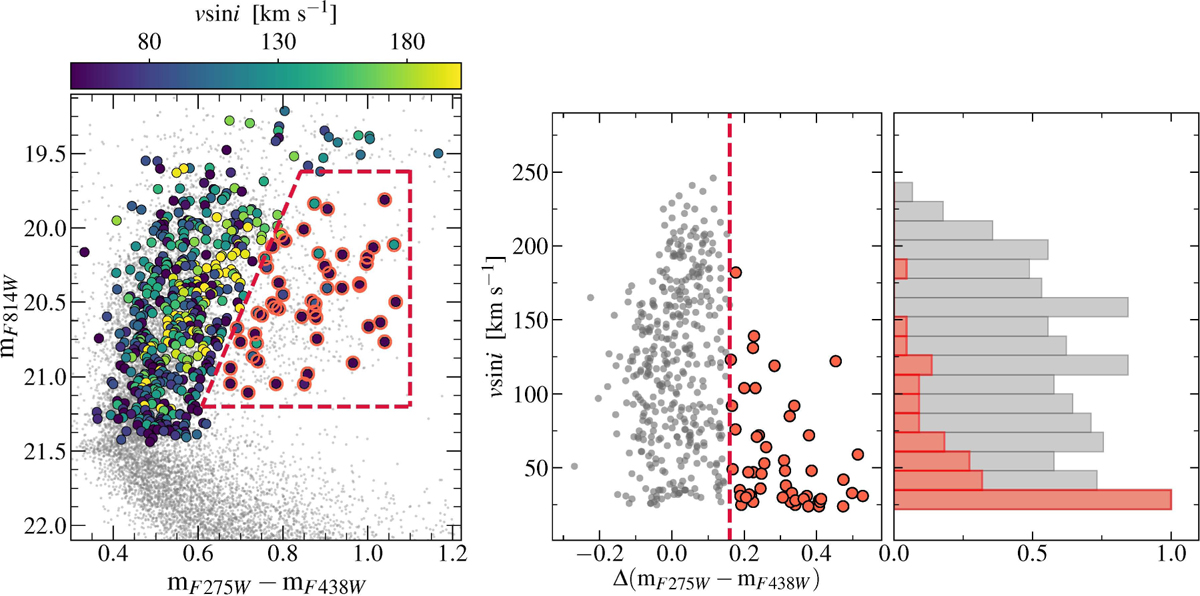
Left panel: CMD focusing on the eMSTO region of NGC 1783. The MUSE targets are represented as large circles, color-coded according to their v sin i values. The dashed red box outlines the selection region for UV-dim stars (see text), which are highlighted by open red circles. Central panel: v sin i of the eMSTO targets in the magnitude range 19.6 < mF814W < 21.2 as a function of the verticalized color. The dashed red line marks the selection edge for the UV-dim stars, corresponding to Δ(mF275W − mF438) = 0.16, with the selected UV-dim stars indicated by red circles. Right panel: normalized histograms of the v sin i distributions for the stars shown in the central panel. The gray histogram represents the eMSTO stars, while the red histogram shows the v sin i distributions for the subsample of UV-dim stars.
Current usage metrics show cumulative count of Article Views (full-text article views including HTML views, PDF and ePub downloads, according to the available data) and Abstracts Views on Vision4Press platform.
Data correspond to usage on the plateform after 2015. The current usage metrics is available 48-96 hours after online publication and is updated daily on week days.
Initial download of the metrics may take a while.