Fig. 11
Download original image
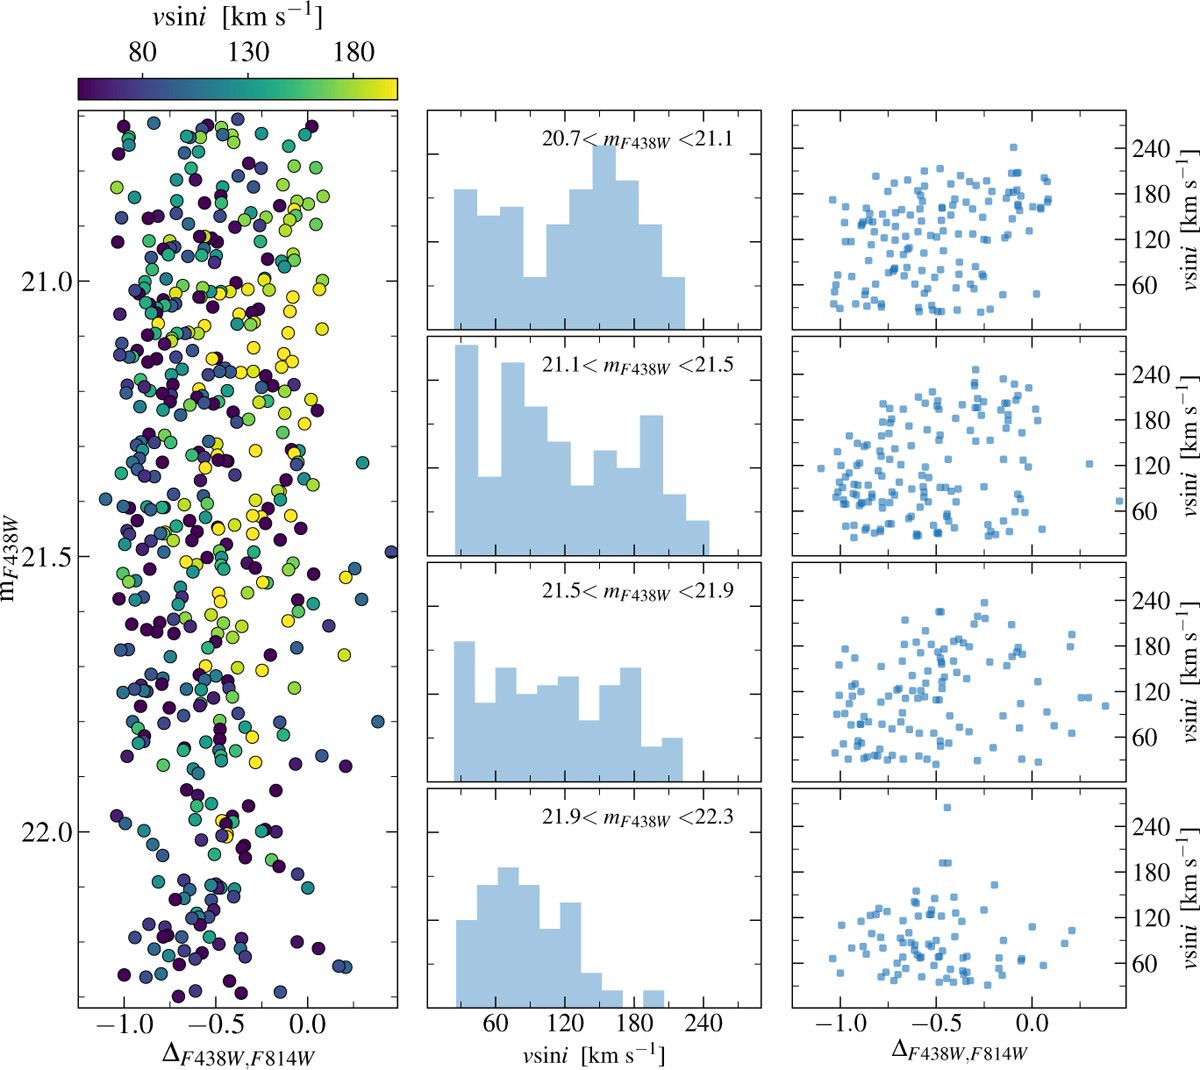
Distribution of v sin i along the eMSTO of NGC 1783. The left panel displays the verticalized color distribution of the eMSTO of NGC 1783, with the targets color-coded according to their vsini values. The central panels show the histograms of the v sin i measurements for the targets in the magnitude bins labeled at the top of each panel. The right panels represent the v sin i values as a function of the pseudo-color ΔF438,F814W of the targets in the same magnitude bins as in the central panels.
Current usage metrics show cumulative count of Article Views (full-text article views including HTML views, PDF and ePub downloads, according to the available data) and Abstracts Views on Vision4Press platform.
Data correspond to usage on the plateform after 2015. The current usage metrics is available 48-96 hours after online publication and is updated daily on week days.
Initial download of the metrics may take a while.