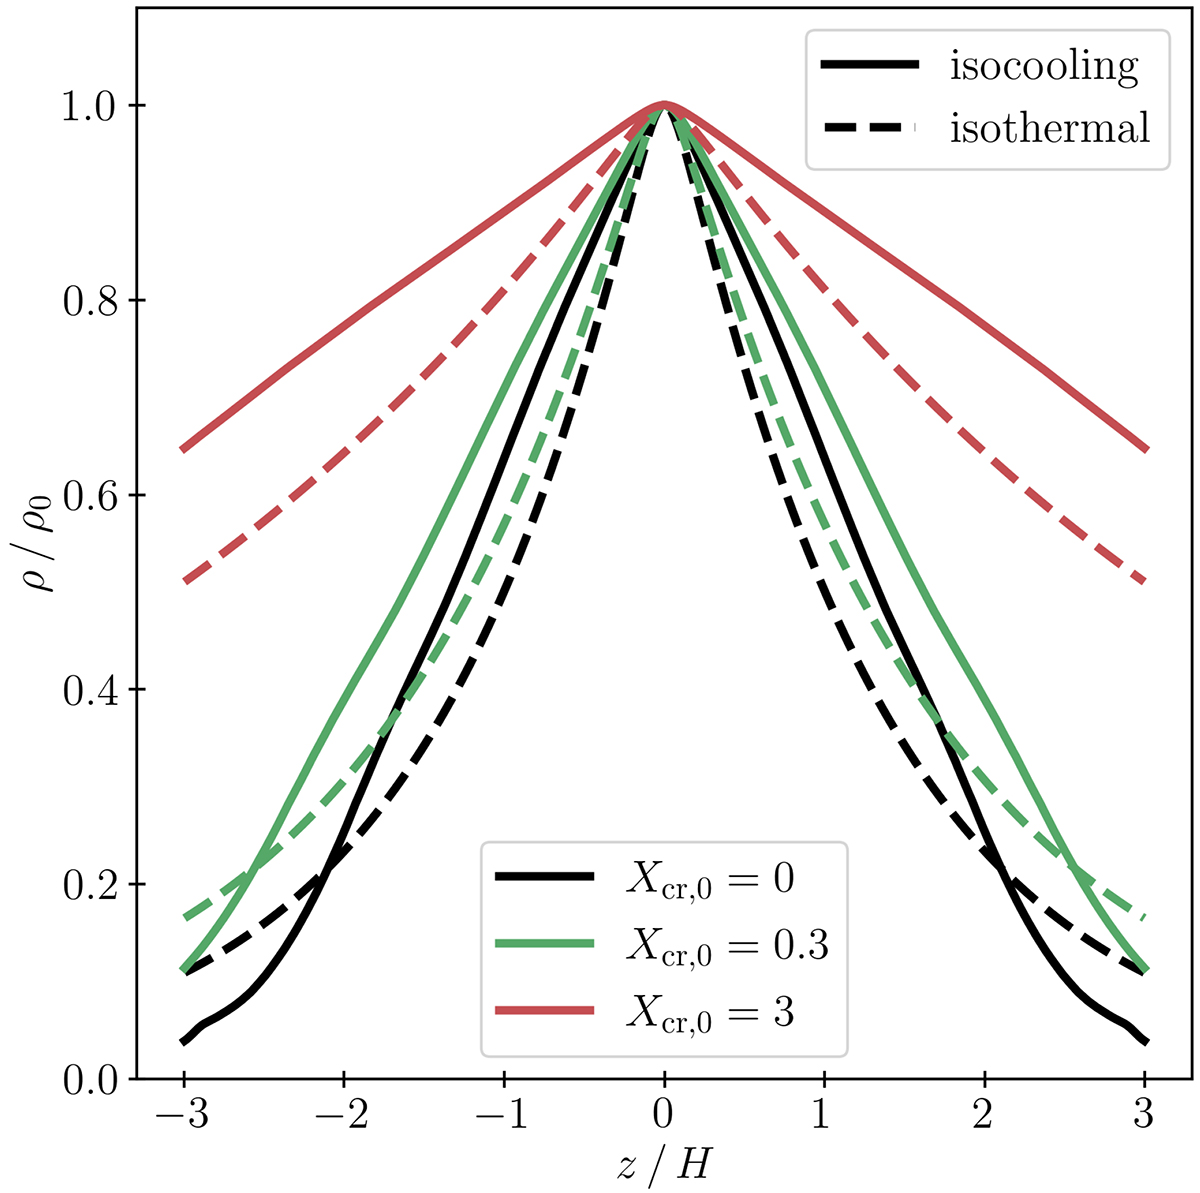
Fig. 3.
Download original image
Initial density profiles of the simulation box for various Xcr, 0. The solid lines show the implemented isocooling density profile, the dashed lines show the corresponding isothermal density profile with T0=106 K for comparison. For a higher initial Xcr, 0, more mass is contained in the atmosphere because the additional CR pressure supports the HSE without contributing to the gravitational force.
Current usage metrics show cumulative count of Article Views (full-text article views including HTML views, PDF and ePub downloads, according to the available data) and Abstracts Views on Vision4Press platform.
Data correspond to usage on the plateform after 2015. The current usage metrics is available 48-96 hours after online publication and is updated daily on week days.
Initial download of the metrics may take a while.