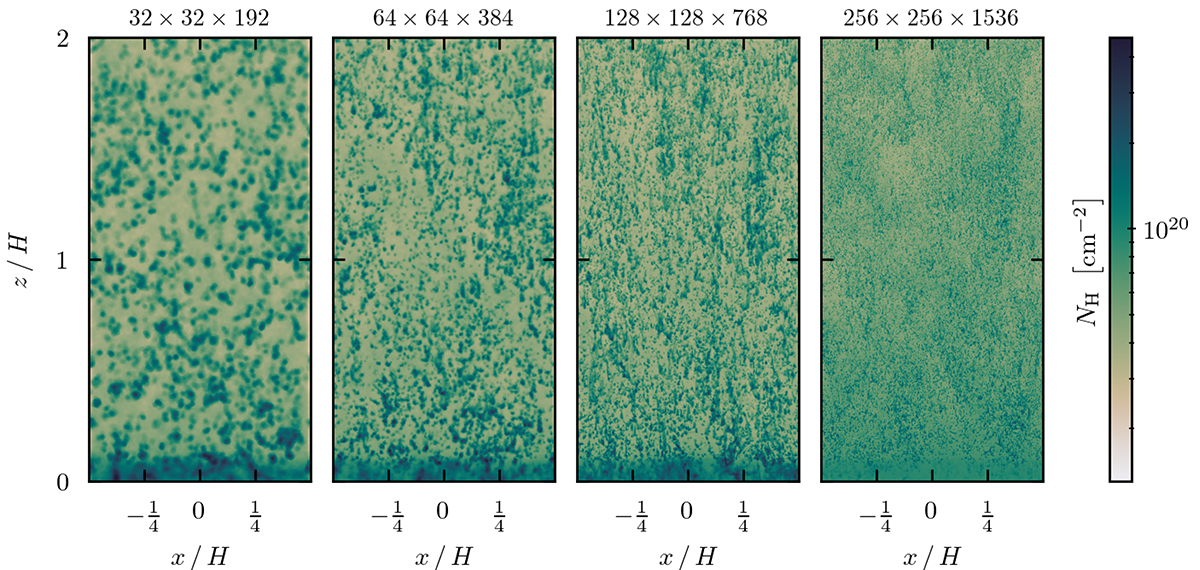
Fig. 16.
Download original image
Projection showing the hydrogen column density, NH, after the simulations run for 8 tcool. From left to right, we plot the results from simulations with increasing resolution where each simulation employs two-moment CR transport and is initialised with Xcr, 0=3. The sizes and number of the cold clouds significantly depend on resolution.
Current usage metrics show cumulative count of Article Views (full-text article views including HTML views, PDF and ePub downloads, according to the available data) and Abstracts Views on Vision4Press platform.
Data correspond to usage on the plateform after 2015. The current usage metrics is available 48-96 hours after online publication and is updated daily on week days.
Initial download of the metrics may take a while.