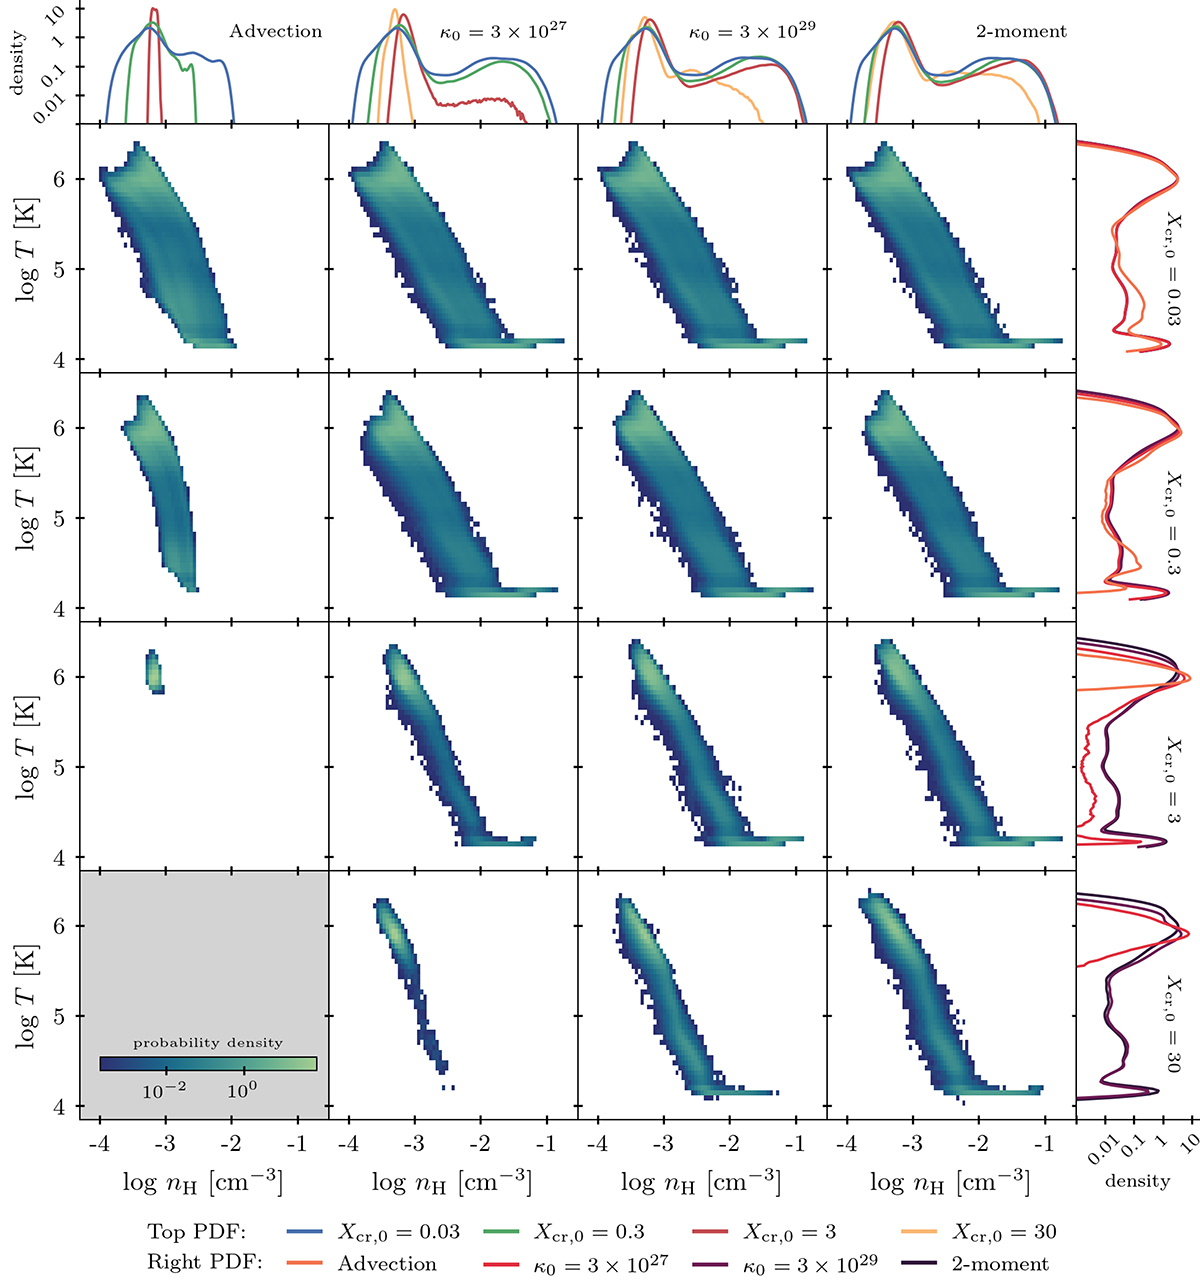
Fig. 15.
Download original image
Mass-weighted nH–T diagrams from our simulation suite. Columns represent different CR transport methods, while rows correspond to varying initial CR pressure fractions, Xcr, 0. The 1D probability densities of the respective variables are shown above each axis: columns reflect the resulting nH distributions for a fixed CR transport method across different Xcr, 0 and rows show the resulting T distributions for a fixed Xcr, 0 across different CR transport methods. The phase diagrams are constructed using 70 bins of equal (logarithmic) width for both variables. All simulations are analysed at t=6 tcool.
Current usage metrics show cumulative count of Article Views (full-text article views including HTML views, PDF and ePub downloads, according to the available data) and Abstracts Views on Vision4Press platform.
Data correspond to usage on the plateform after 2015. The current usage metrics is available 48-96 hours after online publication and is updated daily on week days.
Initial download of the metrics may take a while.