Fig. 13.
Download original image
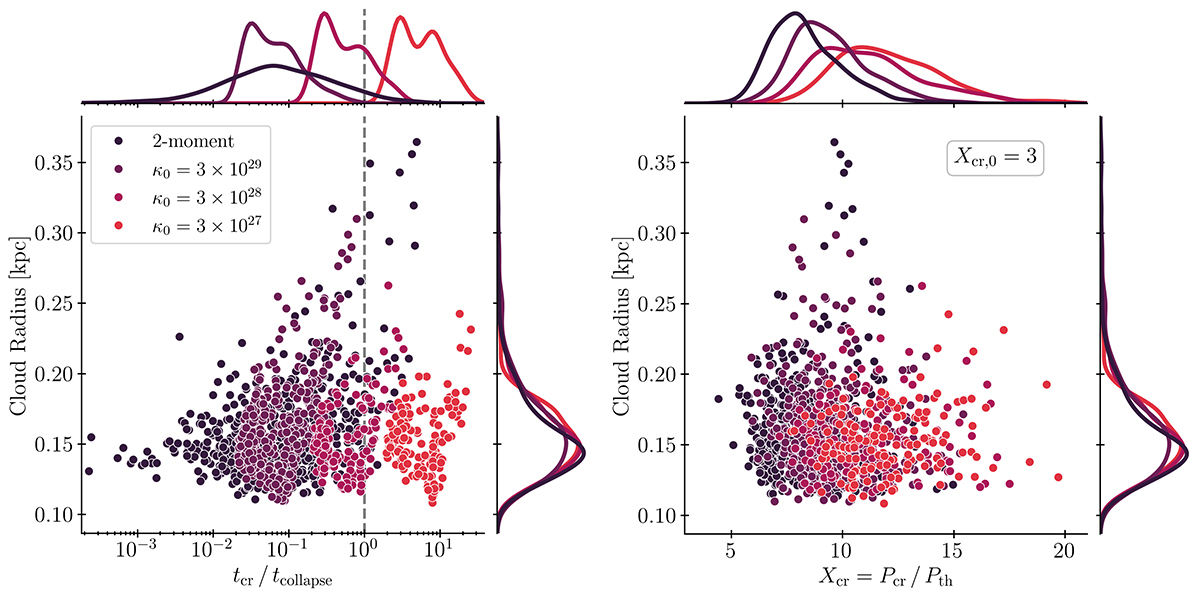
Ratios of the CR transport timescale to the cloud collapse timescale (left) and the relative CR pressure within cold clouds (right), depicted for various cloud radii. The 1D probability density of the corresponding variable is displayed above each axis with a linear scaling. We analyse cold gas clouds within the region −0.25H≤x, y≤0.25H and 0.25H≤z≤1.75H (We focus on this reduced region to avoid double counting clouds across periodic boundaries and to ensure consistent analysis across resolutions (see Sect. 7) because the memory-intensive cloud finder makes analysing the full domain computationally very expensive at high resolutions.), considering eight consecutive snapshots following the identification of the first cloud by the cloud finder. Different colours represent different CR transport models (as detailed in the figure legend). All simulations are initialised with Xcr, 0=3. The dashed vertical line in the left panel separates regions where clouds collapse is slower (tcr/tcollaspe<1) or faster (tcr/tcollaspe>1) than CRs escape these clouds. Fast transport enables CRs to escape collapsing clouds on timescales shorter than the cloud collapse time, reducing their relative pressure. In contrast, slow transport traps CRs within collapsing regions, increasing their pressure support.
Current usage metrics show cumulative count of Article Views (full-text article views including HTML views, PDF and ePub downloads, according to the available data) and Abstracts Views on Vision4Press platform.
Data correspond to usage on the plateform after 2015. The current usage metrics is available 48-96 hours after online publication and is updated daily on week days.
Initial download of the metrics may take a while.