Open Access
Fig. 11.
Download original image
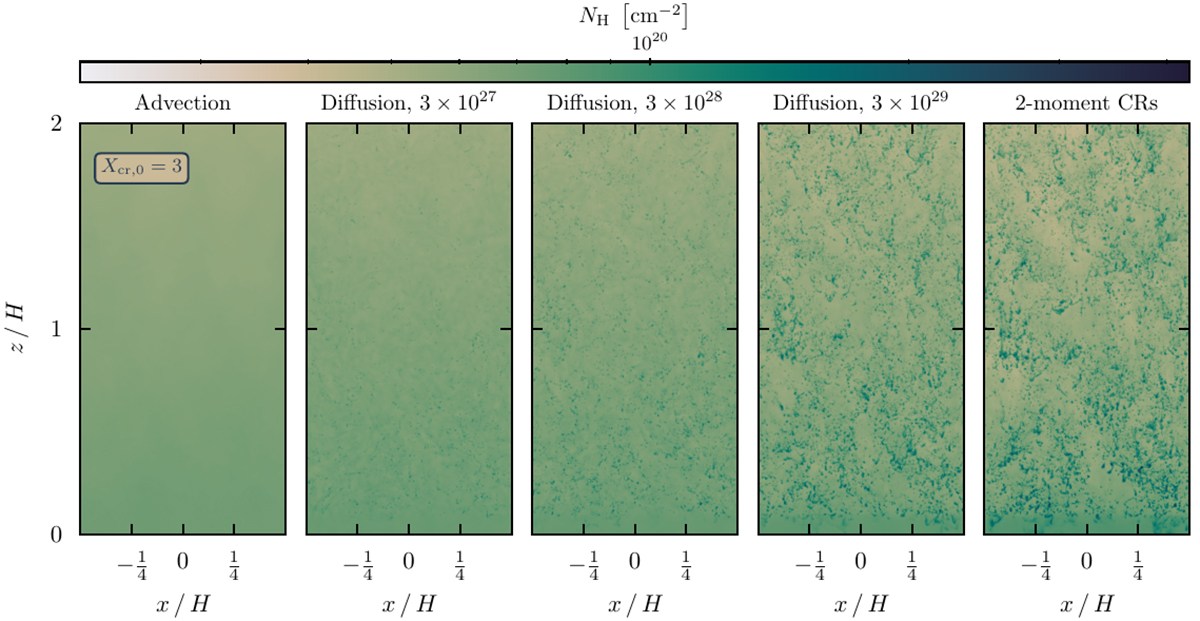
Projections of the hydrogen column density, NH, for simulations utilising different CR transport models. All runs were initialised with Xcr, 0=3, and the snapshots are at t=7 tcool. The figure demonstrates that the onset of collapse is governed by the CR transport velocity rather than the CR pressure.
Current usage metrics show cumulative count of Article Views (full-text article views including HTML views, PDF and ePub downloads, according to the available data) and Abstracts Views on Vision4Press platform.
Data correspond to usage on the plateform after 2015. The current usage metrics is available 48-96 hours after online publication and is updated daily on week days.
Initial download of the metrics may take a while.