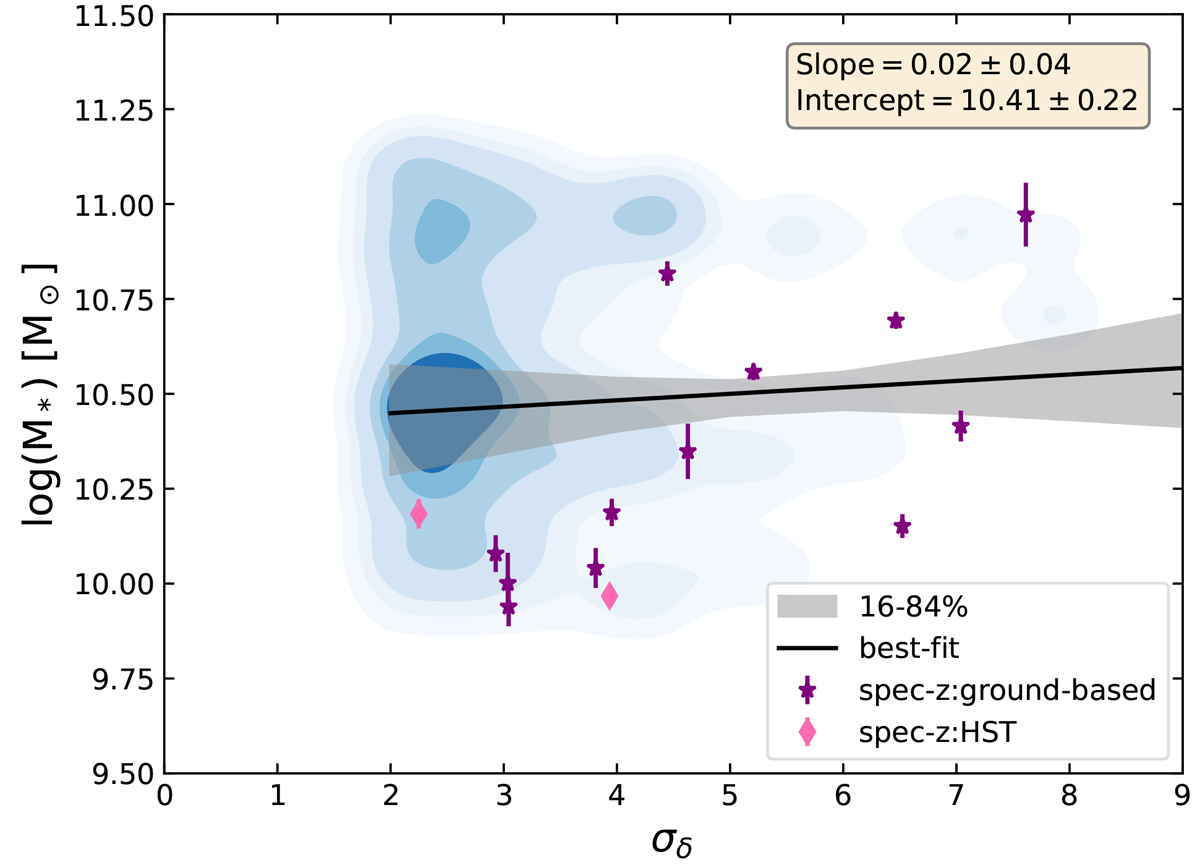
Fig. B.1.
Download original image
Stellar mass as a function of the local over-density of galaxies in Hyperion. The blue-contours represent the distribution of the photo-z galaxies from their 1000 realisations. The purple stars are the spec-z Hyperion members, the pink diamonds represent the spec-z galaxies from HST-Hyperion sample. The best fit relation and the 1-σ error are shown as the black-solid line and the grey shaded regions respectively. The best-fit slopes and intercepts are written in the inset-yellow panel. The errors on the slopes and intercepts are the standard deviation of the slopes and intercepts of the 1000 relations.
Current usage metrics show cumulative count of Article Views (full-text article views including HTML views, PDF and ePub downloads, according to the available data) and Abstracts Views on Vision4Press platform.
Data correspond to usage on the plateform after 2015. The current usage metrics is available 48-96 hours after online publication and is updated daily on week days.
Initial download of the metrics may take a while.