Fig. 4.
Download original image
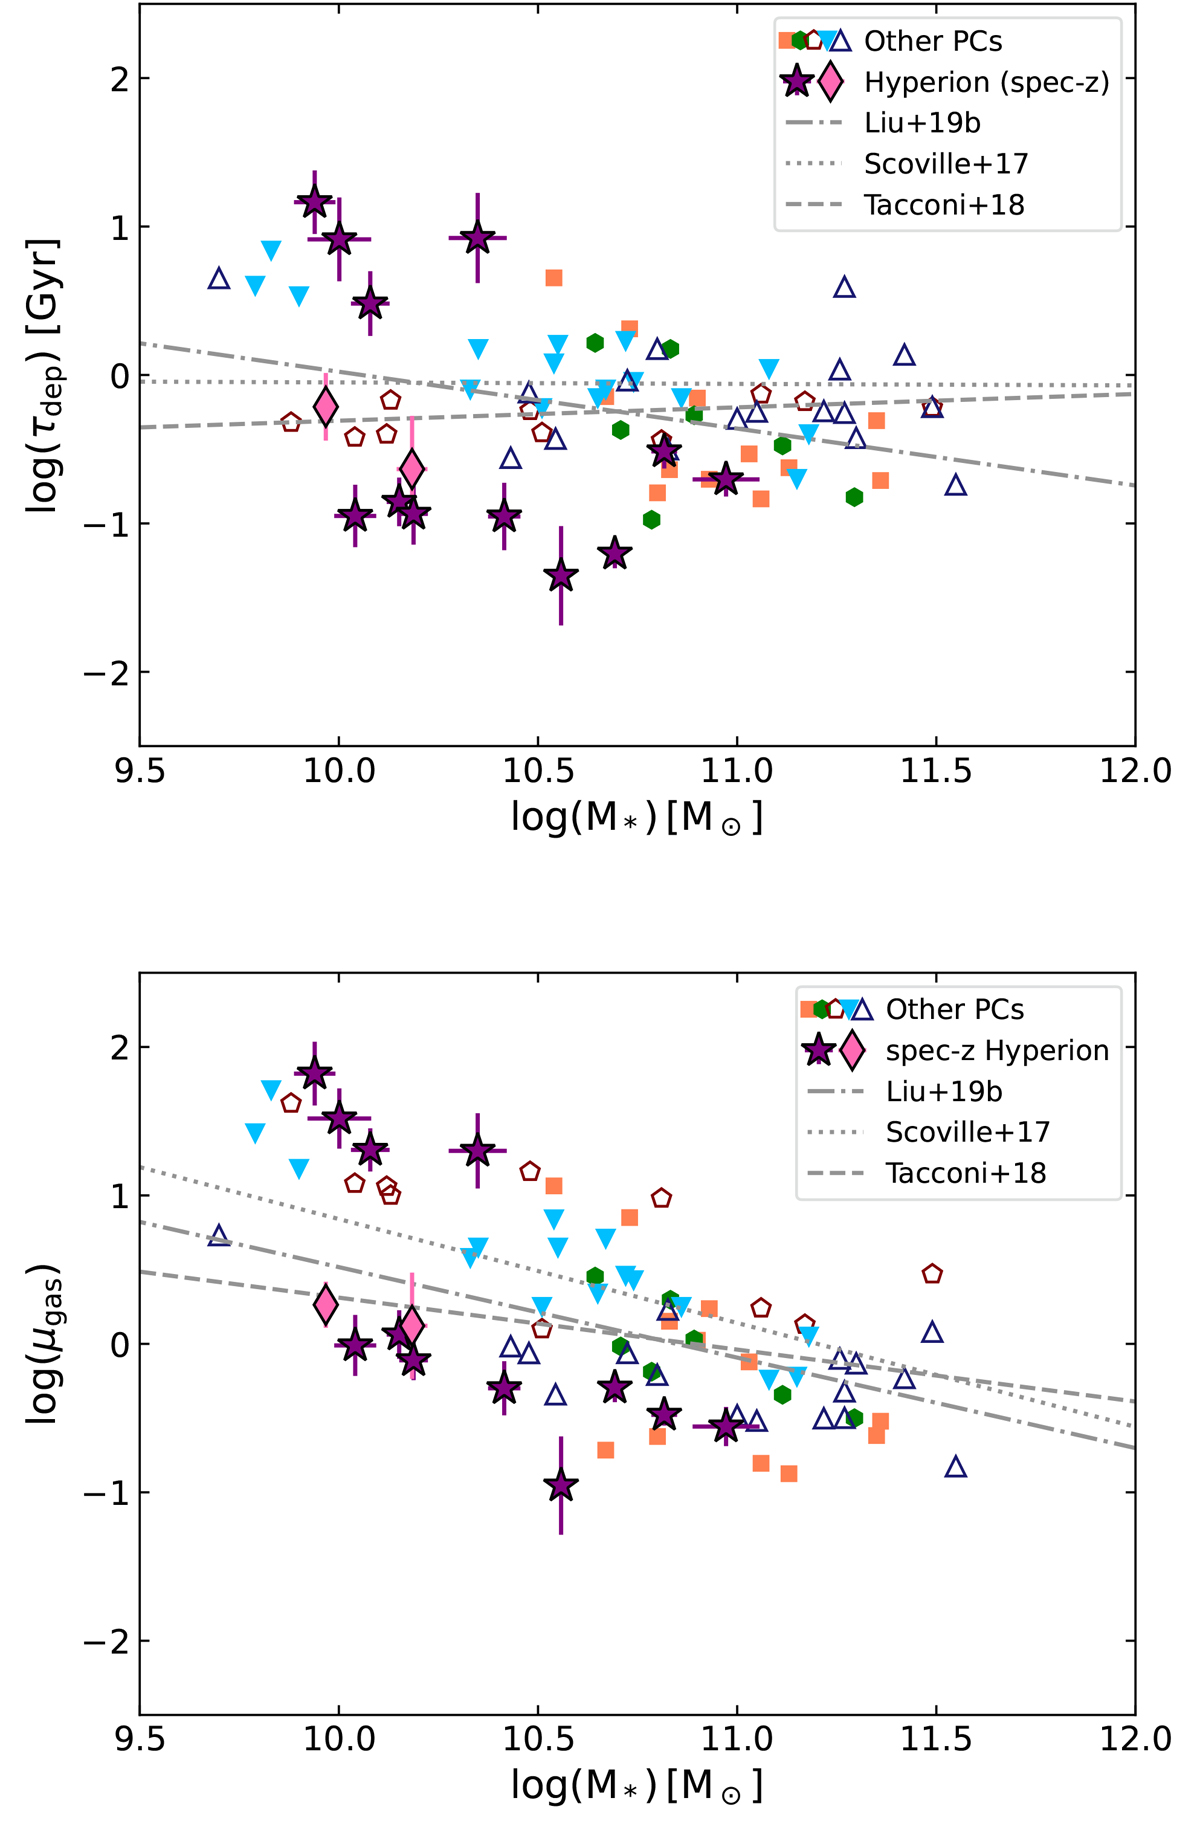
Depletion timescale (top panel) and molecular gas fraction (bottom panel) as a function of stellar mass. The purple stars and pink diamond represent the ground-based and HST spec-z members of Hyperion respectively. The comparison sample consists of proto-cluster galaxies in the literature between z∼2−3 (Lee et al. 2017 in green-filled hexagons, Wang et al. 2018 in orange-filled squares, Gómez-Guijarro et al. 2019 in maroon open pentagons, Tadaki et al. 2019 in blue downward triangles, and Zavala et al. 2019 in dark-blue open triangles). The main-sequence depletion times and gas fractions at z∼2.45 from Scoville et al. (2017), Tacconi et al. (2018), Liu et al. (2019b) are plotted as the dotted, dashed and dot-dashed lines.
Current usage metrics show cumulative count of Article Views (full-text article views including HTML views, PDF and ePub downloads, according to the available data) and Abstracts Views on Vision4Press platform.
Data correspond to usage on the plateform after 2015. The current usage metrics is available 48-96 hours after online publication and is updated daily on week days.
Initial download of the metrics may take a while.