Fig. A.1.
Download original image
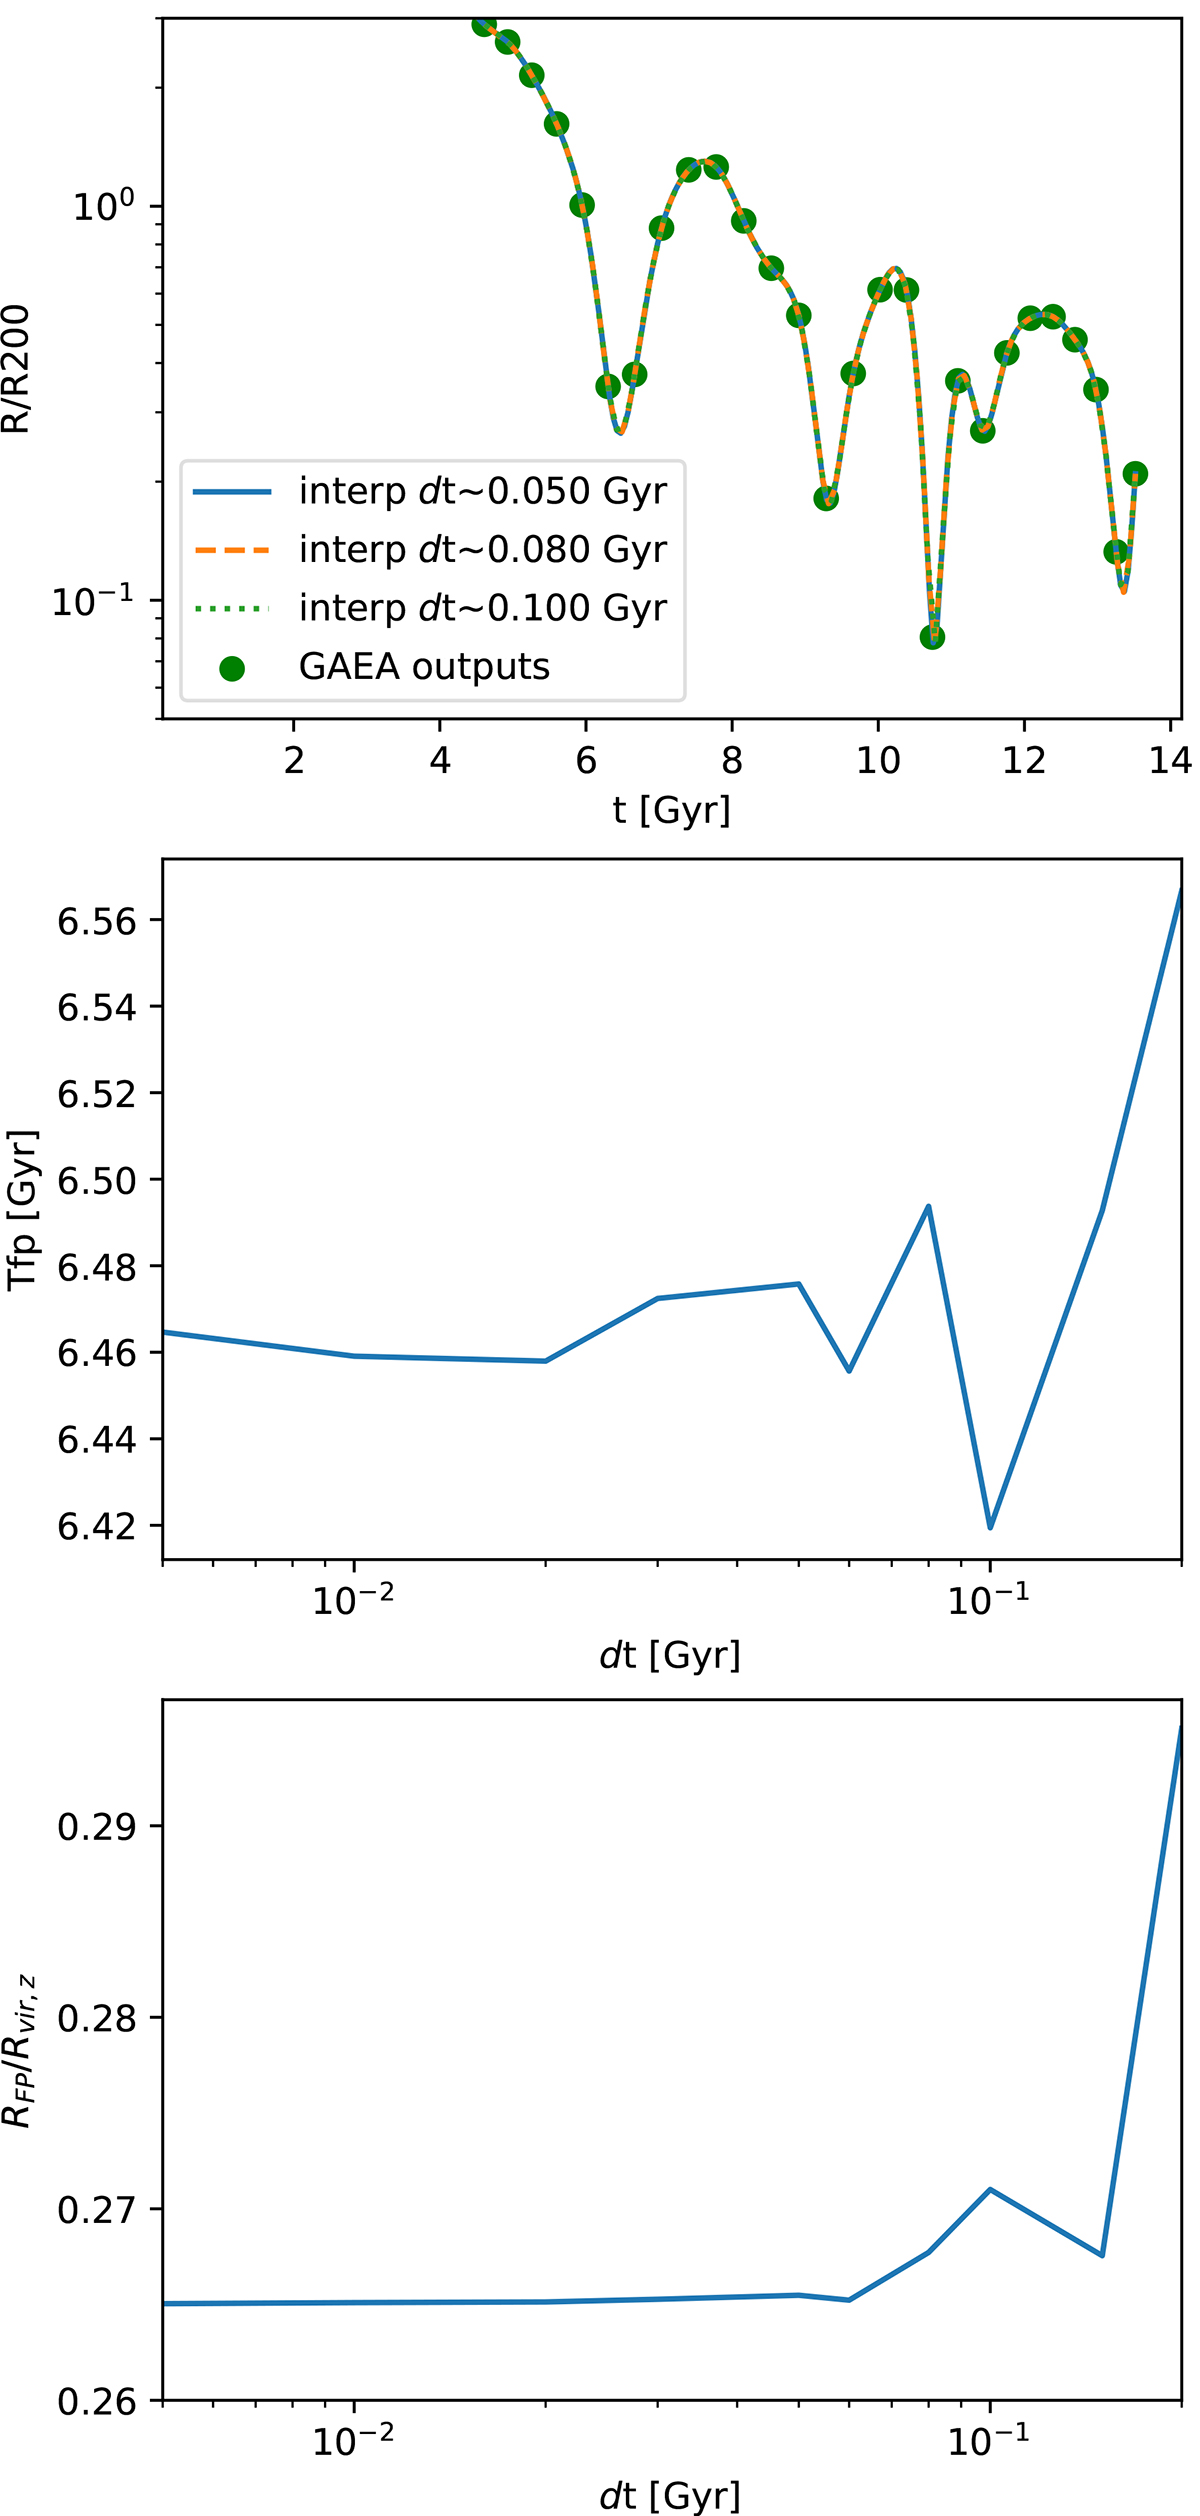
Example of the interpolation of a satellite’s orbit. The top panel shows the normalized distances to the cluster center. Green points are model outputs, at the available snapshots of the simulation. Different lines show interpolations over different time steps. The middle and bottom panels are the TFP and RFP measured from the interpolated orbits as a function of the interpolation time-scale adopted.
Current usage metrics show cumulative count of Article Views (full-text article views including HTML views, PDF and ePub downloads, according to the available data) and Abstracts Views on Vision4Press platform.
Data correspond to usage on the plateform after 2015. The current usage metrics is available 48-96 hours after online publication and is updated daily on week days.
Initial download of the metrics may take a while.