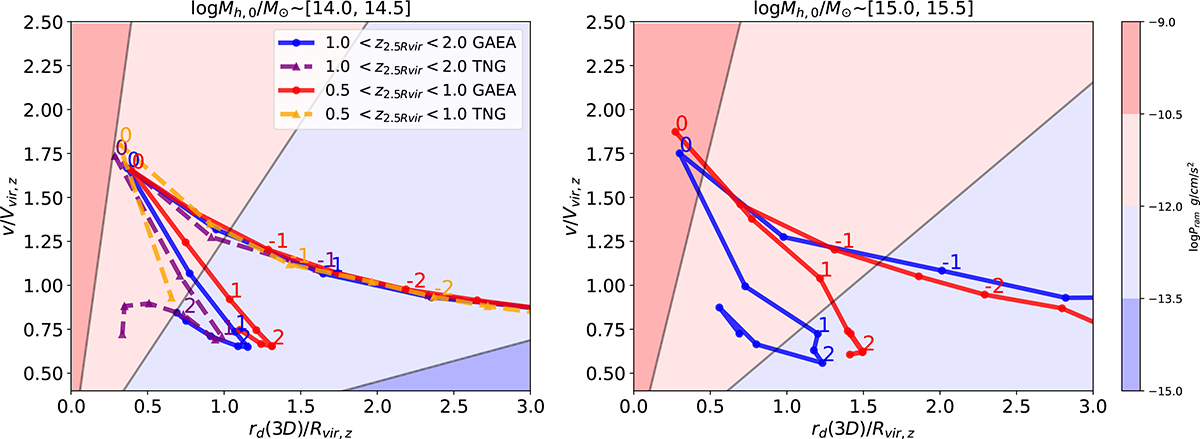
Fig. 5.
Download original image
Orbit of galaxies (9 < log M⋆/M⊙ < 9.5) falling onto the z = 0 cluster halos at redshift 1 < z < 2 and 0.5 < z < 1. Red, pink, light blue, and blue shaded regions mark the strong, moderate, weak, and no RPS zones at z ∼ 0.5. The left and right panels show the orbits of galaxies in different halo mass ranges. Different colors indicate different bins of infall time. Solid and dashed lines show results for GAEA and TNG galaxies. The numbers next to the orbits indicate the time T − TFP in units of Gyr. Negative and positive values correspond to time before and after the pericenter.
Current usage metrics show cumulative count of Article Views (full-text article views including HTML views, PDF and ePub downloads, according to the available data) and Abstracts Views on Vision4Press platform.
Data correspond to usage on the plateform after 2015. The current usage metrics is available 48-96 hours after online publication and is updated daily on week days.
Initial download of the metrics may take a while.