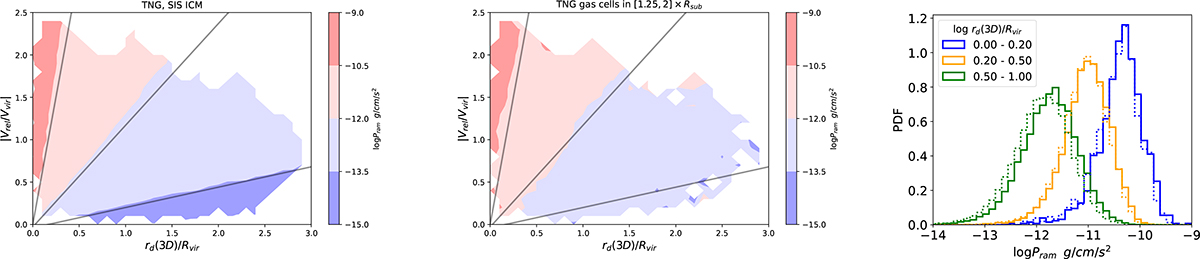
Fig. 4.
Download original image
RP distribution in phase-space around cluster halos from TNG at z = 0. The ram pressure in left panel is measured using the simplified procedure as adopted for GAEA, while the ram pressure in the middle panel is derived from gas cells. The right panel shows the distribution of ram pressure derived directly from gas cells and using the simplified procedure (solid and dotted histograms, respectively). Different colors correspond to different cluster-centric distances, as indicated in the legend.
Current usage metrics show cumulative count of Article Views (full-text article views including HTML views, PDF and ePub downloads, according to the available data) and Abstracts Views on Vision4Press platform.
Data correspond to usage on the plateform after 2015. The current usage metrics is available 48-96 hours after online publication and is updated daily on week days.
Initial download of the metrics may take a while.