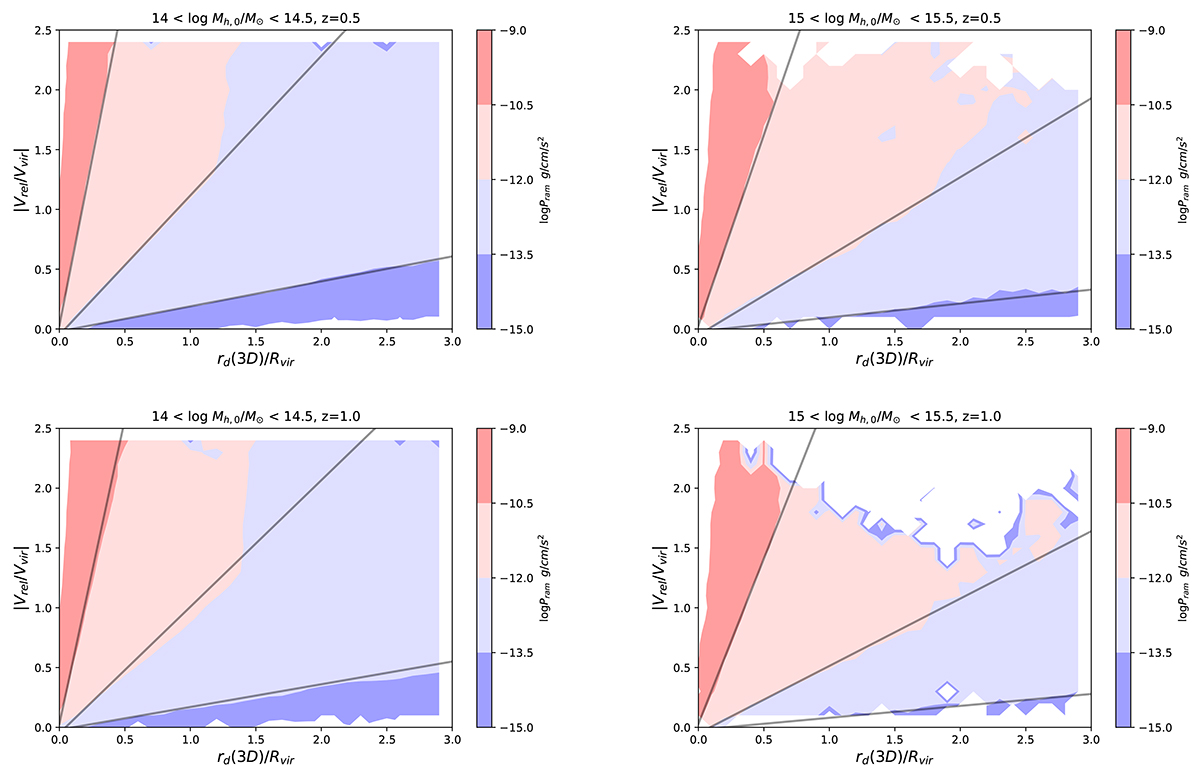
Fig. 3.
Download original image
Median ram-pressure distributions around progenitors of the z = 0 cluster halos from GAEA. The redshift and halo mass range are labeled above each panel. The x and y axes are 3D radius and velocity normalized by the virial radius and virial velocity. Different colors mark the four RPS zones defined in Section 3.1. Gray lines separating different zones are fits obtained as a function of redshift and host halo mass, defined by Equation (4).
Current usage metrics show cumulative count of Article Views (full-text article views including HTML views, PDF and ePub downloads, according to the available data) and Abstracts Views on Vision4Press platform.
Data correspond to usage on the plateform after 2015. The current usage metrics is available 48-96 hours after online publication and is updated daily on week days.
Initial download of the metrics may take a while.