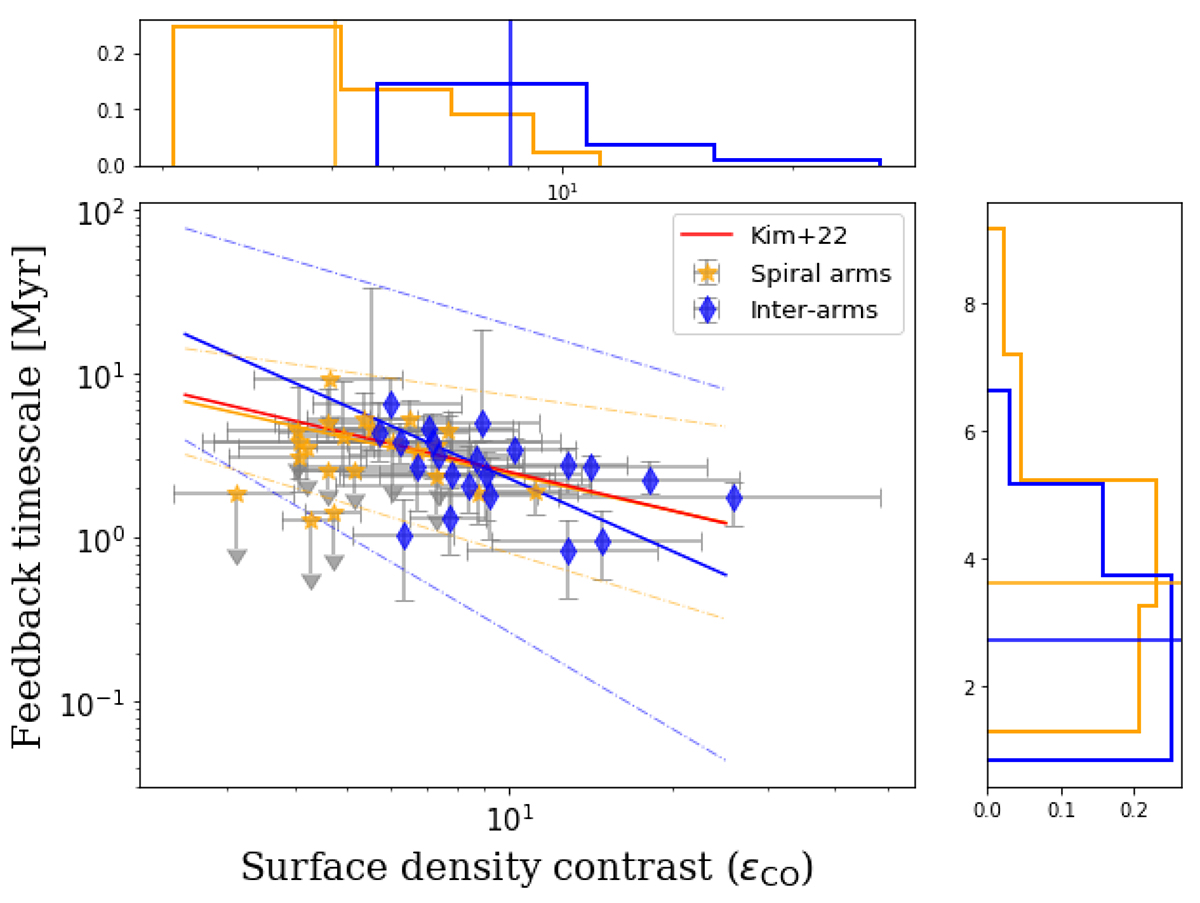
Fig. 5.
Download original image
Scatter plot of the feedback timescale as a function of the surface density contrast between the CO emission peaks and the galactic average (εCO; see text). Spiral arms are represented in orange, inter-arm regions in blue. The solid lines represent the linear models fitted to the data in logarithmic space for each of the two environments. The red line marks the correlation obtained by Kim et al. (2022) for full galaxies, on a wider sample of 54 galaxies (including the 22 analysed in this work). The dashed lines represent the 1σ confidence intervals of the linear model for spiral arms (orange) and inter-arm regions (blue).
Current usage metrics show cumulative count of Article Views (full-text article views including HTML views, PDF and ePub downloads, according to the available data) and Abstracts Views on Vision4Press platform.
Data correspond to usage on the plateform after 2015. The current usage metrics is available 48-96 hours after online publication and is updated daily on week days.
Initial download of the metrics may take a while.