Fig. 4.
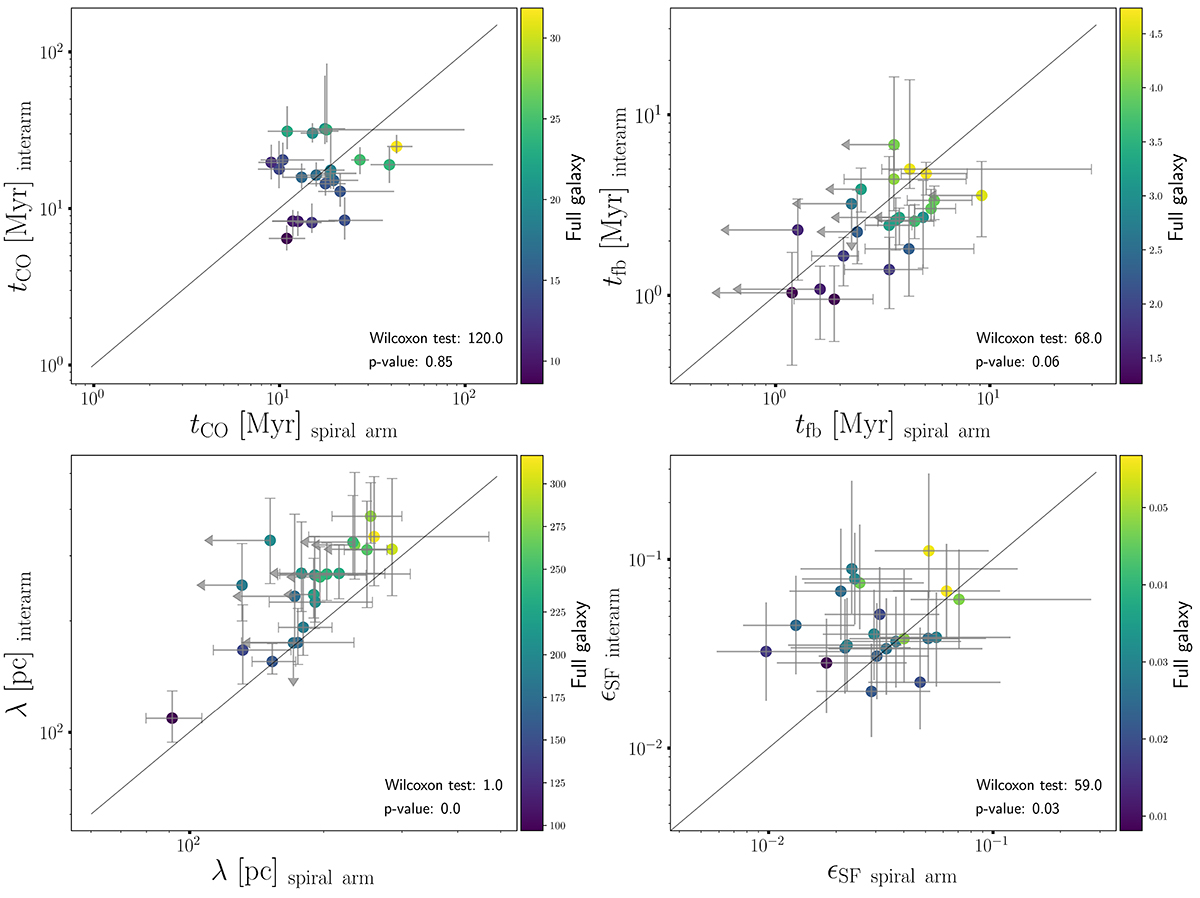
Download original image
Cloud lifetime (top left), feedback timescale (top right), region separation length (bottom left), and integrated SFE (bottom right) measured through our statistical analysis. For each parameter, we report the values calculated in the spiral arms on the x-axis and in the inter-arm regions on the y-axis for each galaxy. The grey line shows the one-to-one relation. Each data point is colour-coded according to the averaged value obtained by Kim et al. (2022) for the full galaxy. For the feedback timescale and the region separation length, upper limits in the spiral arms are indicated with arrows.
Current usage metrics show cumulative count of Article Views (full-text article views including HTML views, PDF and ePub downloads, according to the available data) and Abstracts Views on Vision4Press platform.
Data correspond to usage on the plateform after 2015. The current usage metrics is available 48-96 hours after online publication and is updated daily on week days.
Initial download of the metrics may take a while.